


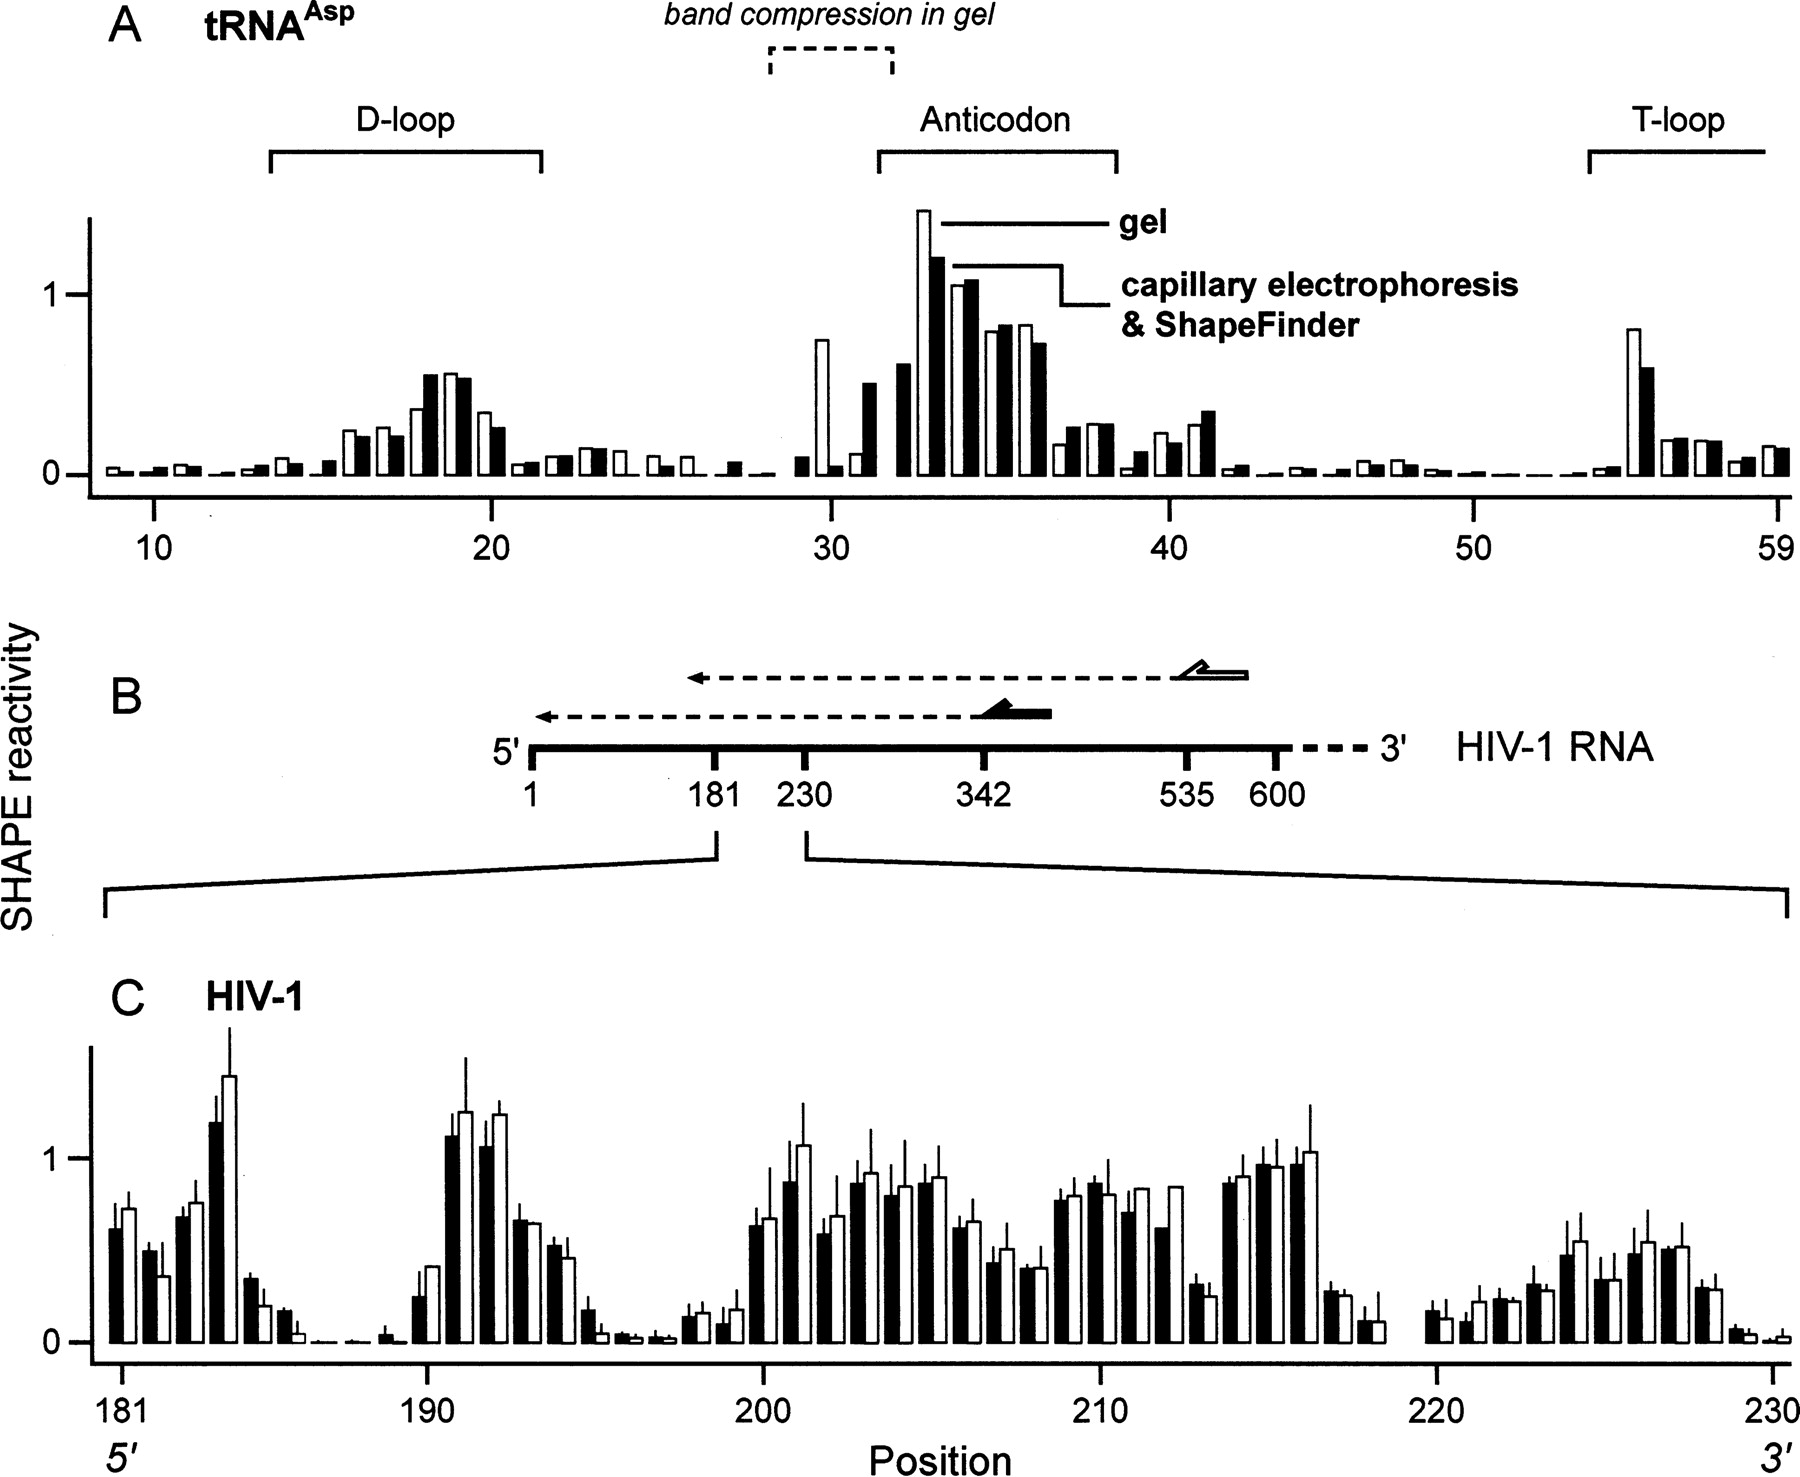
Accuracy and reproducibility of hSHAPE and ShapeFinder. (A) Comparison of nucleotide reactivity as quantified by ShapeFinder (solid bars) and denaturing gel electrophoresis (open bars). Loops in tRNAAsp are indicated explicitly. Bands visualized by gel electrophoresis were quantified using SAFA (Das et al. 2005). (B) Overlapping reads for HIV-1 genome transcripts. Primers (solid and open arrows) anneal to the RNA 193 nt apart; reads (dashed lines) therefore overlap by ∼200 nt. (C) Mean hSHAPE reactivities and standard deviations calculated from overlapping and replicate reads. Primers annealed at positions 342–363 (solid columns) and 535–555 (open columns). Data shown report three experiments from the 342 primer and two experiments from the 535 primer; whiskers report standard deviations. Due to high background, no data were available at nucleotide 219.




