


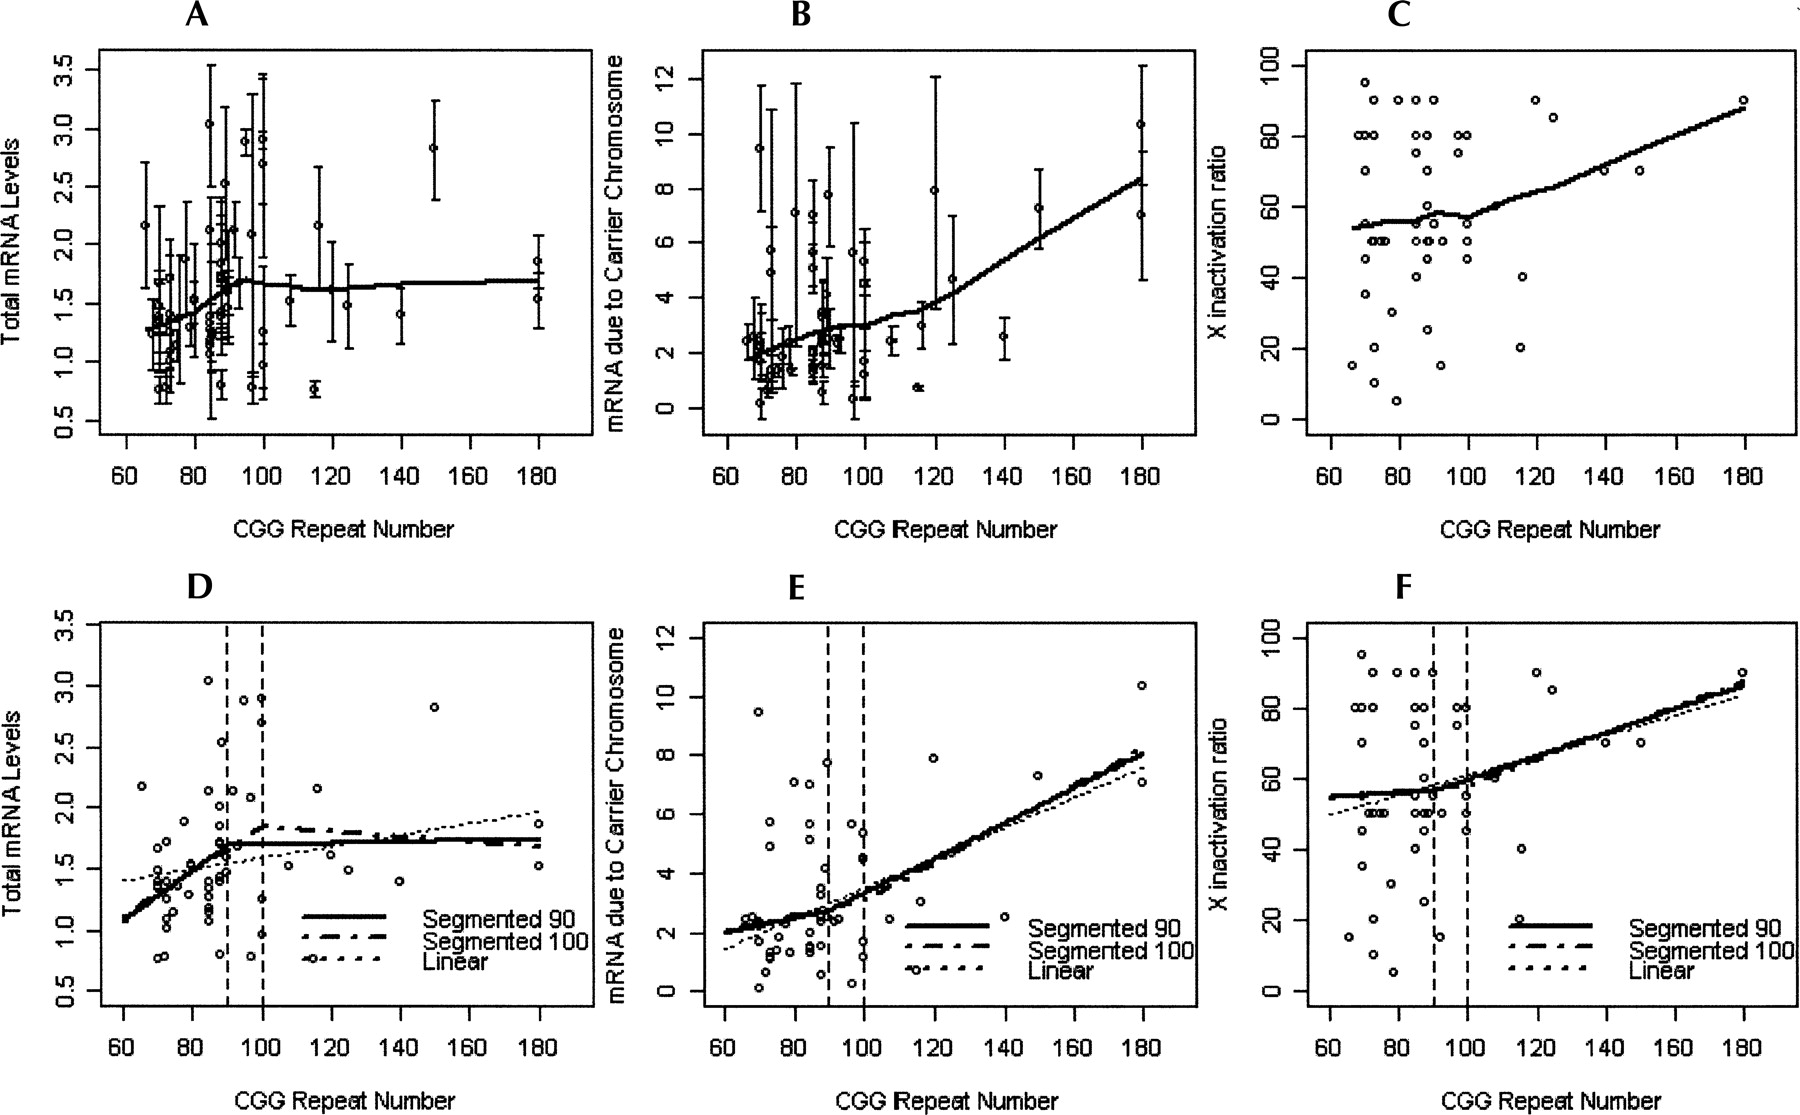
FIGURE 1.
mRNA versus molecular status. (A) Error bar plot and lowess curve for total mRNA levels, (B) error bar plot and lowess curve for mRNA due to carrier chromosome, (C) scatter plot and lowess curve for X inactivation ratio, (D) linear and segmented regression models with cutoffs of 90 and 100 for mRNA levels, (E) linear and segmented regression models with cutoffs of 90 and 100 for mRNA levels due to carrier chromosome, and (F) linear and segmented regression models with cutoffs of 90 and 100 for X inactivation ratio.




