


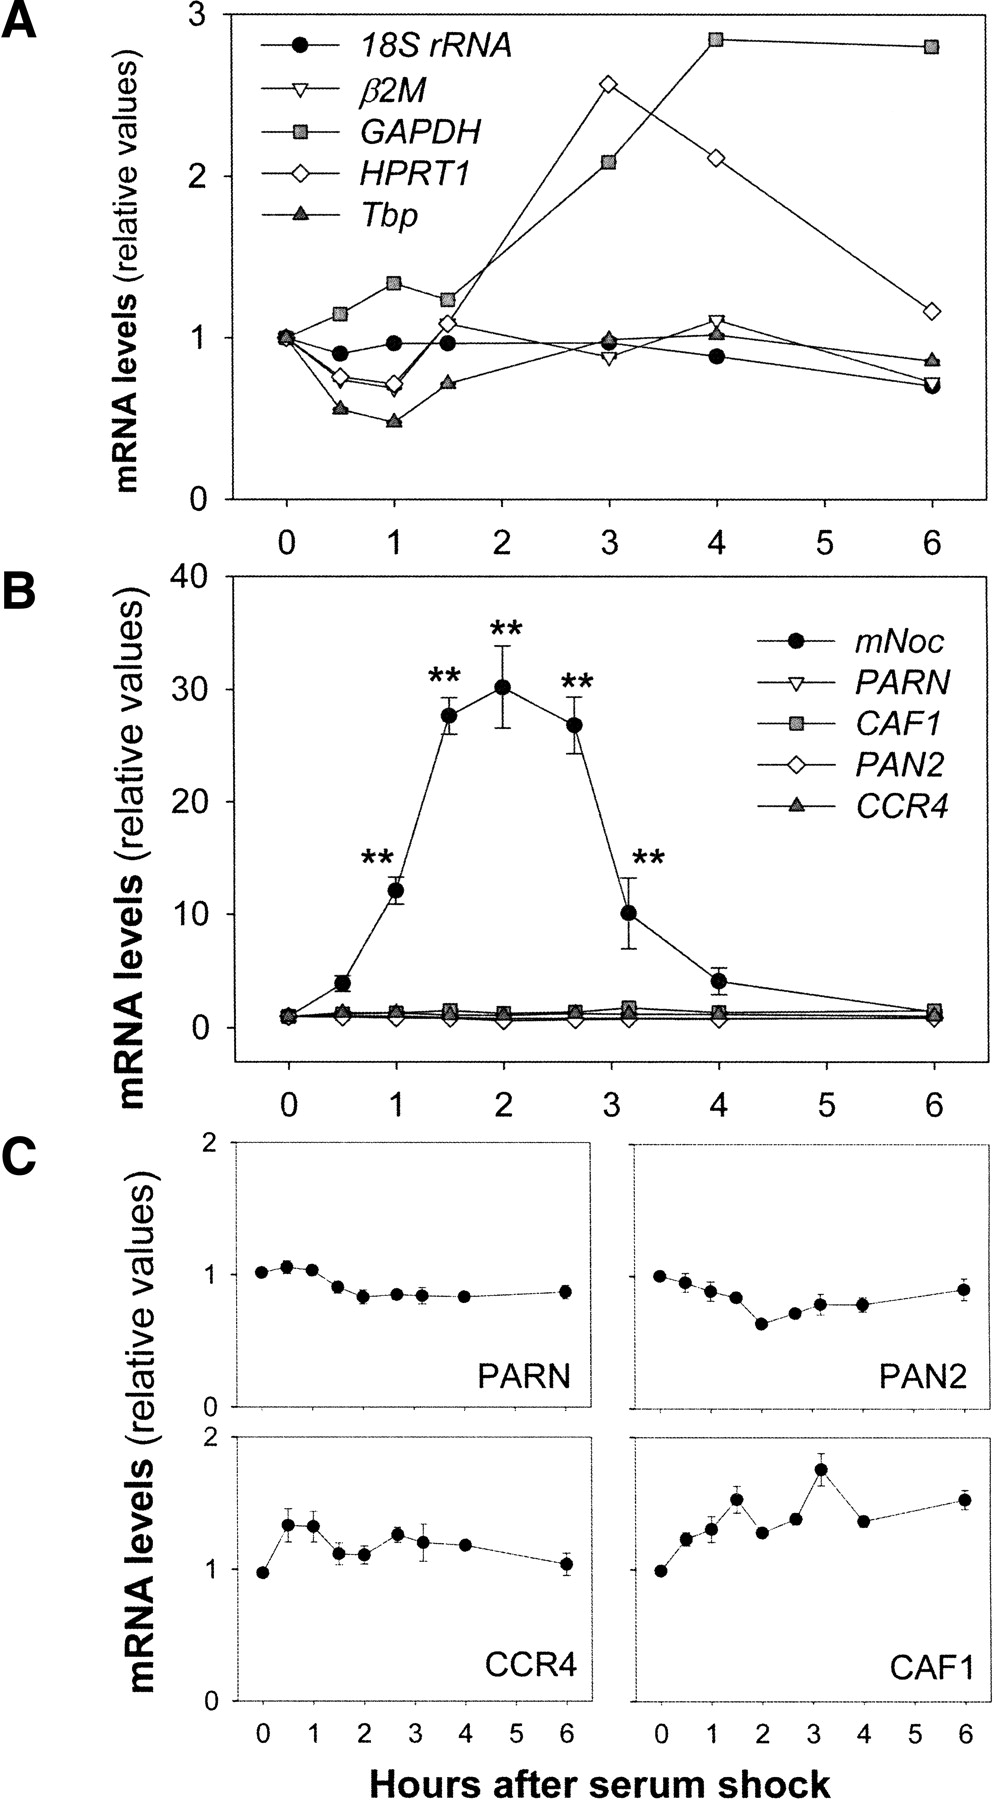
mNoc is the unique deadenylase induced in serum-stimulated NIH3T3 cells. Quiescent NIH3T3 cells were serum starved for 16 h in 0.5% FBS-DMEM, then stimulated with 50% horse serum-DMEM, and after 2 h the medium was replaced by 0.5% FBS-DMEM. The specific mRNA levels were determined by real-time RT-PCR. (A) Analysis of potential “housekeeping” genes for data normalization. The total RNA starting quantities were similar in all time points, the data were normalized as fold change compared with T = 0. (B) Effect of serum shock on five deadenylase mRNA levels. mNoc transcript, but not CCR4, CAF1, PAN2, and PARN mRNAs, is induced in serum-shocked NIH3T3 cells. (C) The same data presented in B were plotted again with a different scale to visualize changes in CCR4, CAF1, PAN2, and PARN mRNAs. In B and C, individual data were normalized by the Pfaffl method considering T = 0 values as the calibrator, and β2M as the reference gene. The graphs show the results of two independent experiments in which measurements were done by triplicate (n = 6/group); values are the mean ± SEM. Only mNoc (F = 42, p = 5.6E-17) and CAF1 (F = 8, p = 2.4E-06) showed significant changes by ANOVA. (**) p < 0.001 by post hoc comparisons.




