


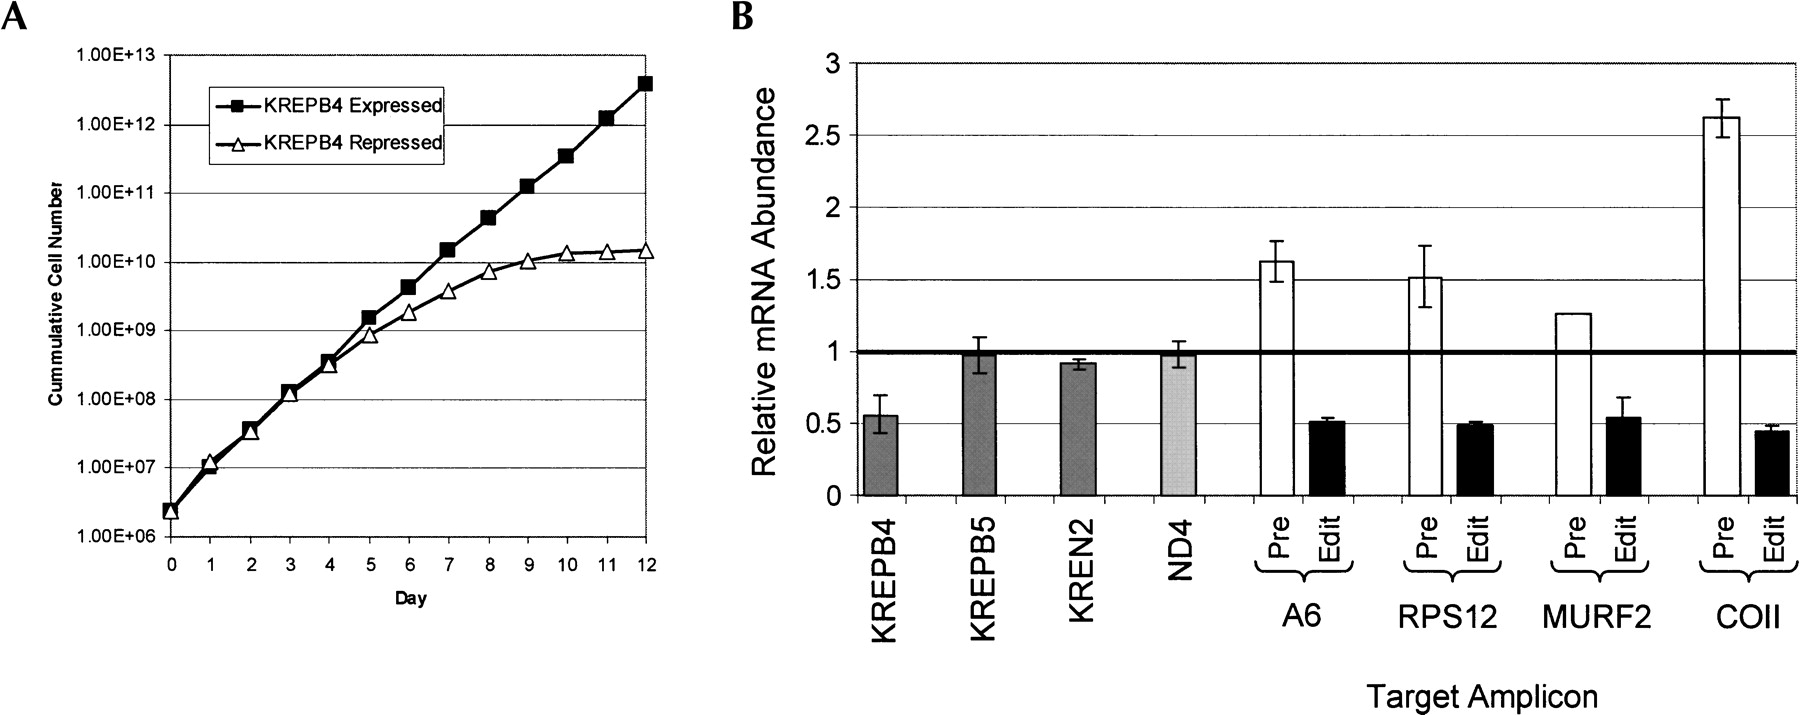
Loss of KREPB4 by RNAi induction inhibits T. brucei cell growth and reduces edited RNA abundance in vivo. (A) Growth curve of a PF RNAi cell line in which KREPB4 is expressed (absence of RNAi induction, closed squares) or repressed after RNAi induction with tet (open triangles). Cell growth was monitored for 12 d, and the cumulative cell number represents the normalization of cell densities by multiplication with the dilution factor. (B) Real-time quantitative RT-PCR analysis of total RNA isolated from cells after induction of KREPB4 RNAi for 3 d. The abundance of pre-edited (open bars) and edited (black bars) mitochondrial RNAs from repressed cells are shown relative to that from cells in which KREPB4 is expressed. The relative abundance of KREPB4, KREPB5, and KREN2 mRNAs (dark gray bars) and never edited ND4 mRNA (light gray bar) is also shown. The RNA levels were normalized to 18S rRNA. The thick horizontal black line intersecting at 1 on the Y-axis indicates no change in mRNA level, with anything above or below this line representing an increase or decrease in mRNA levels, respectively. Error bars, SD calculated from at least three replicates.




