


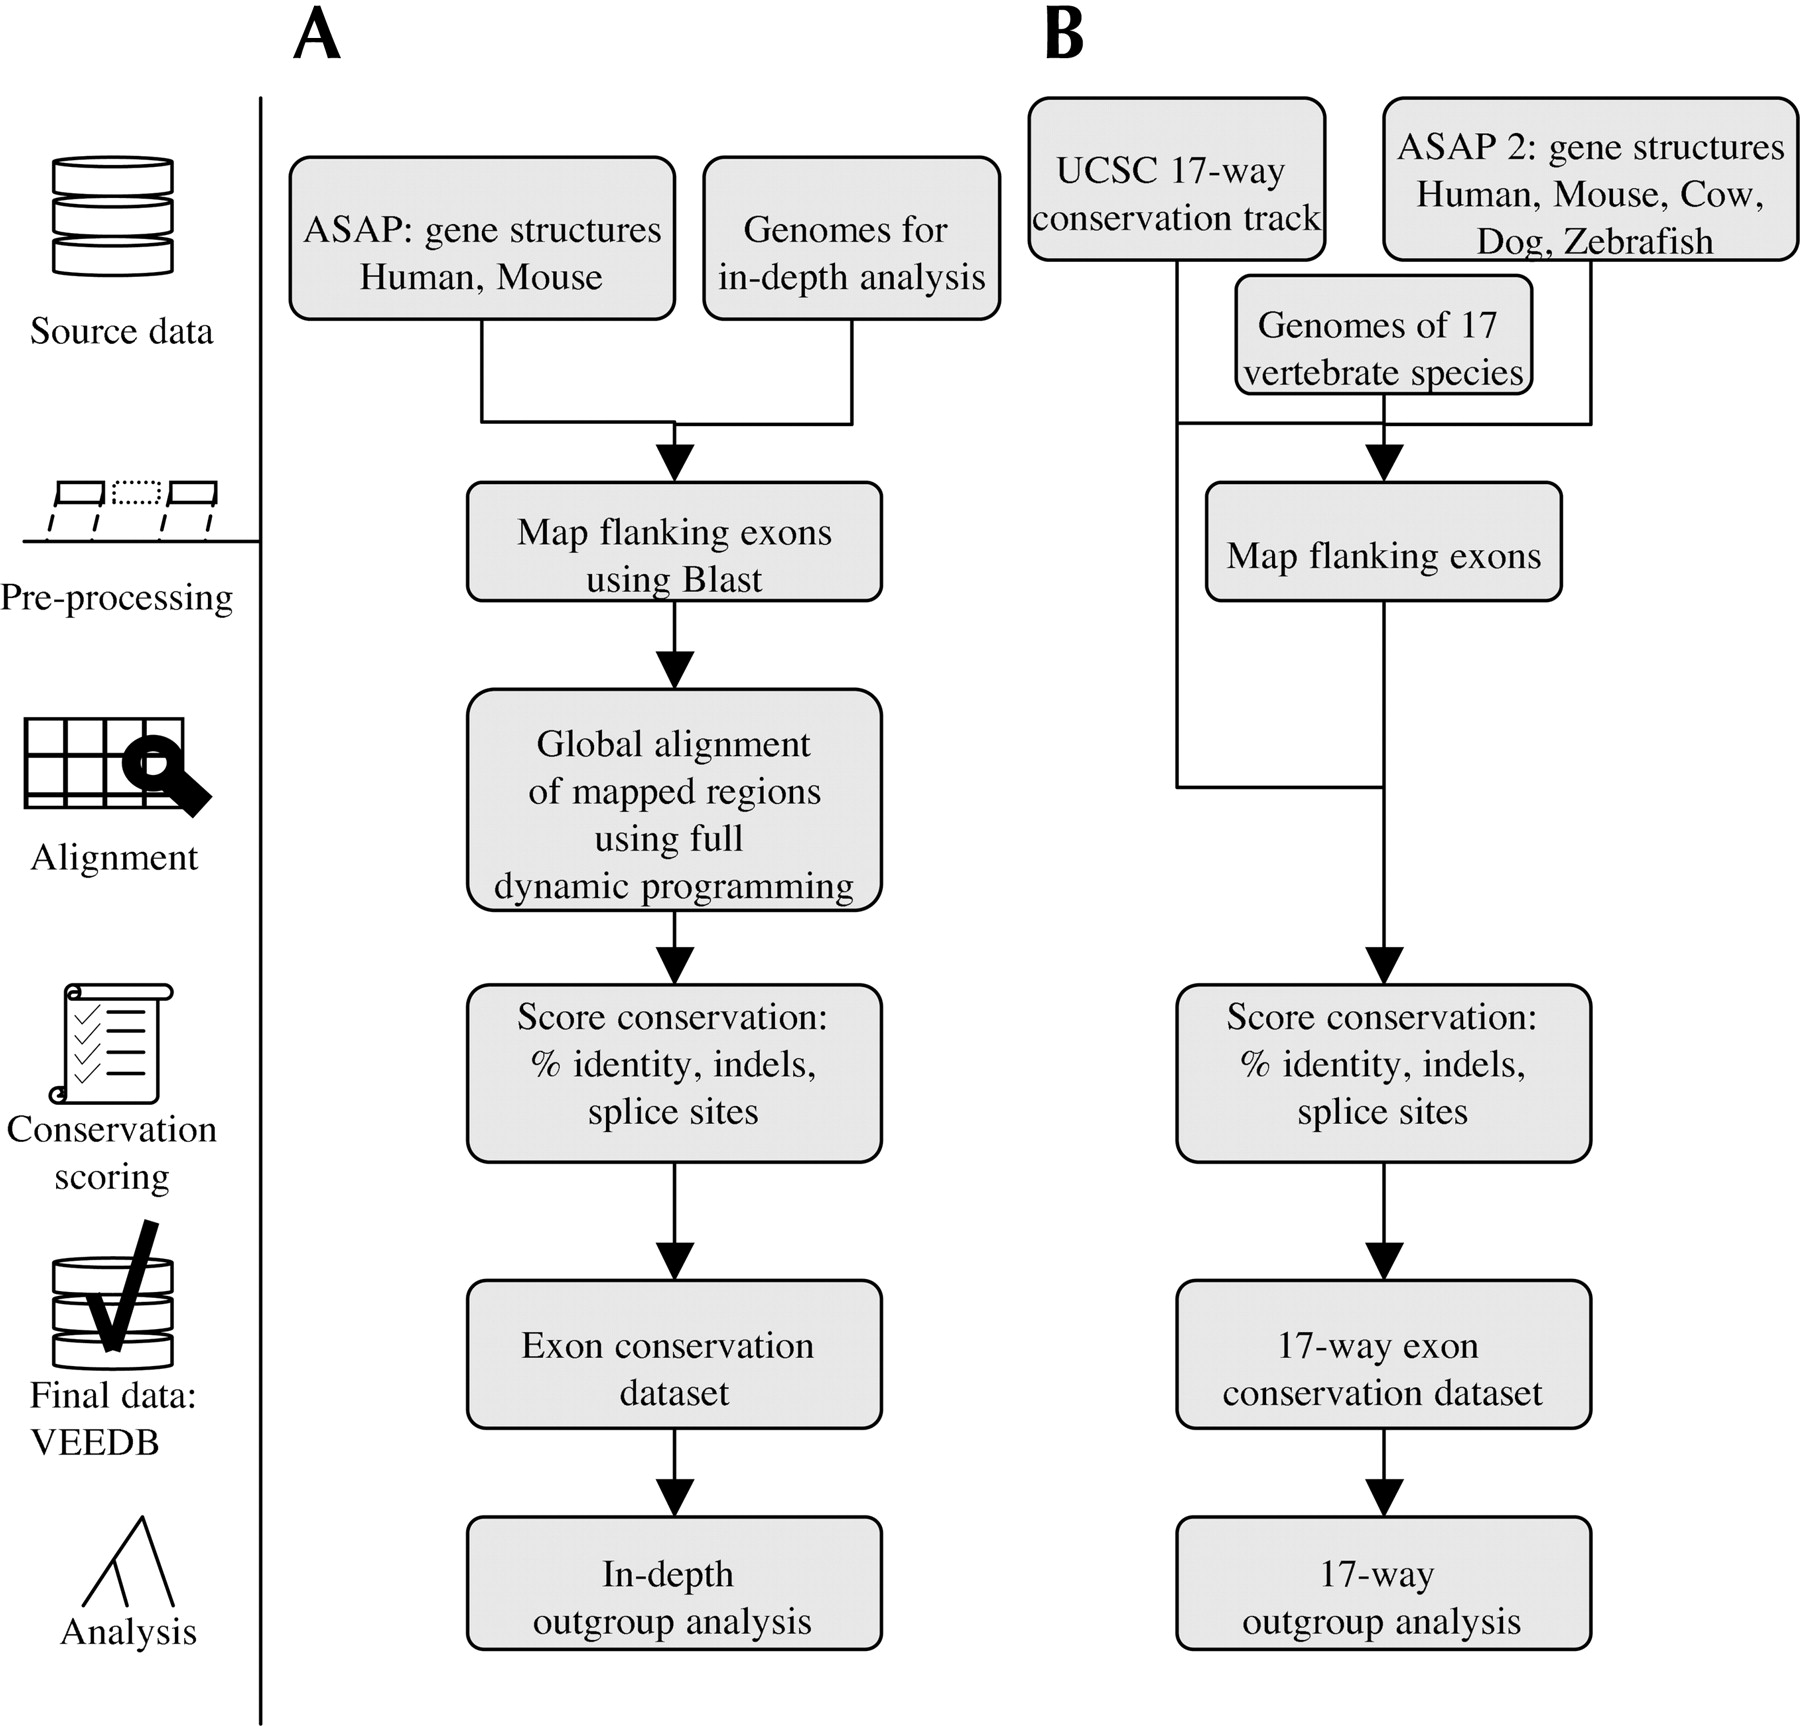
Dataflow of the analyses. Analyses of two data sets are schematically depicted: (A) in-depth study, (B) 17-way exon conservation analysis. Roughly, the analysis consisted of the following steps. Source data collection included downloading and arranging data. In the preprocessing step, we identified the regions that should contain the exons in question by mapping the adjacent (flanking) exons onto the target genomes. Then we aligned (in A) introns using full dynamic programming and (in B) just the exons and splice sites using UCSC conservation track. Next, the alignments were scored using various metrics of conservation. The resulting conservation data sets make up the VEEDB database and were used for further outgroup analyses.




