


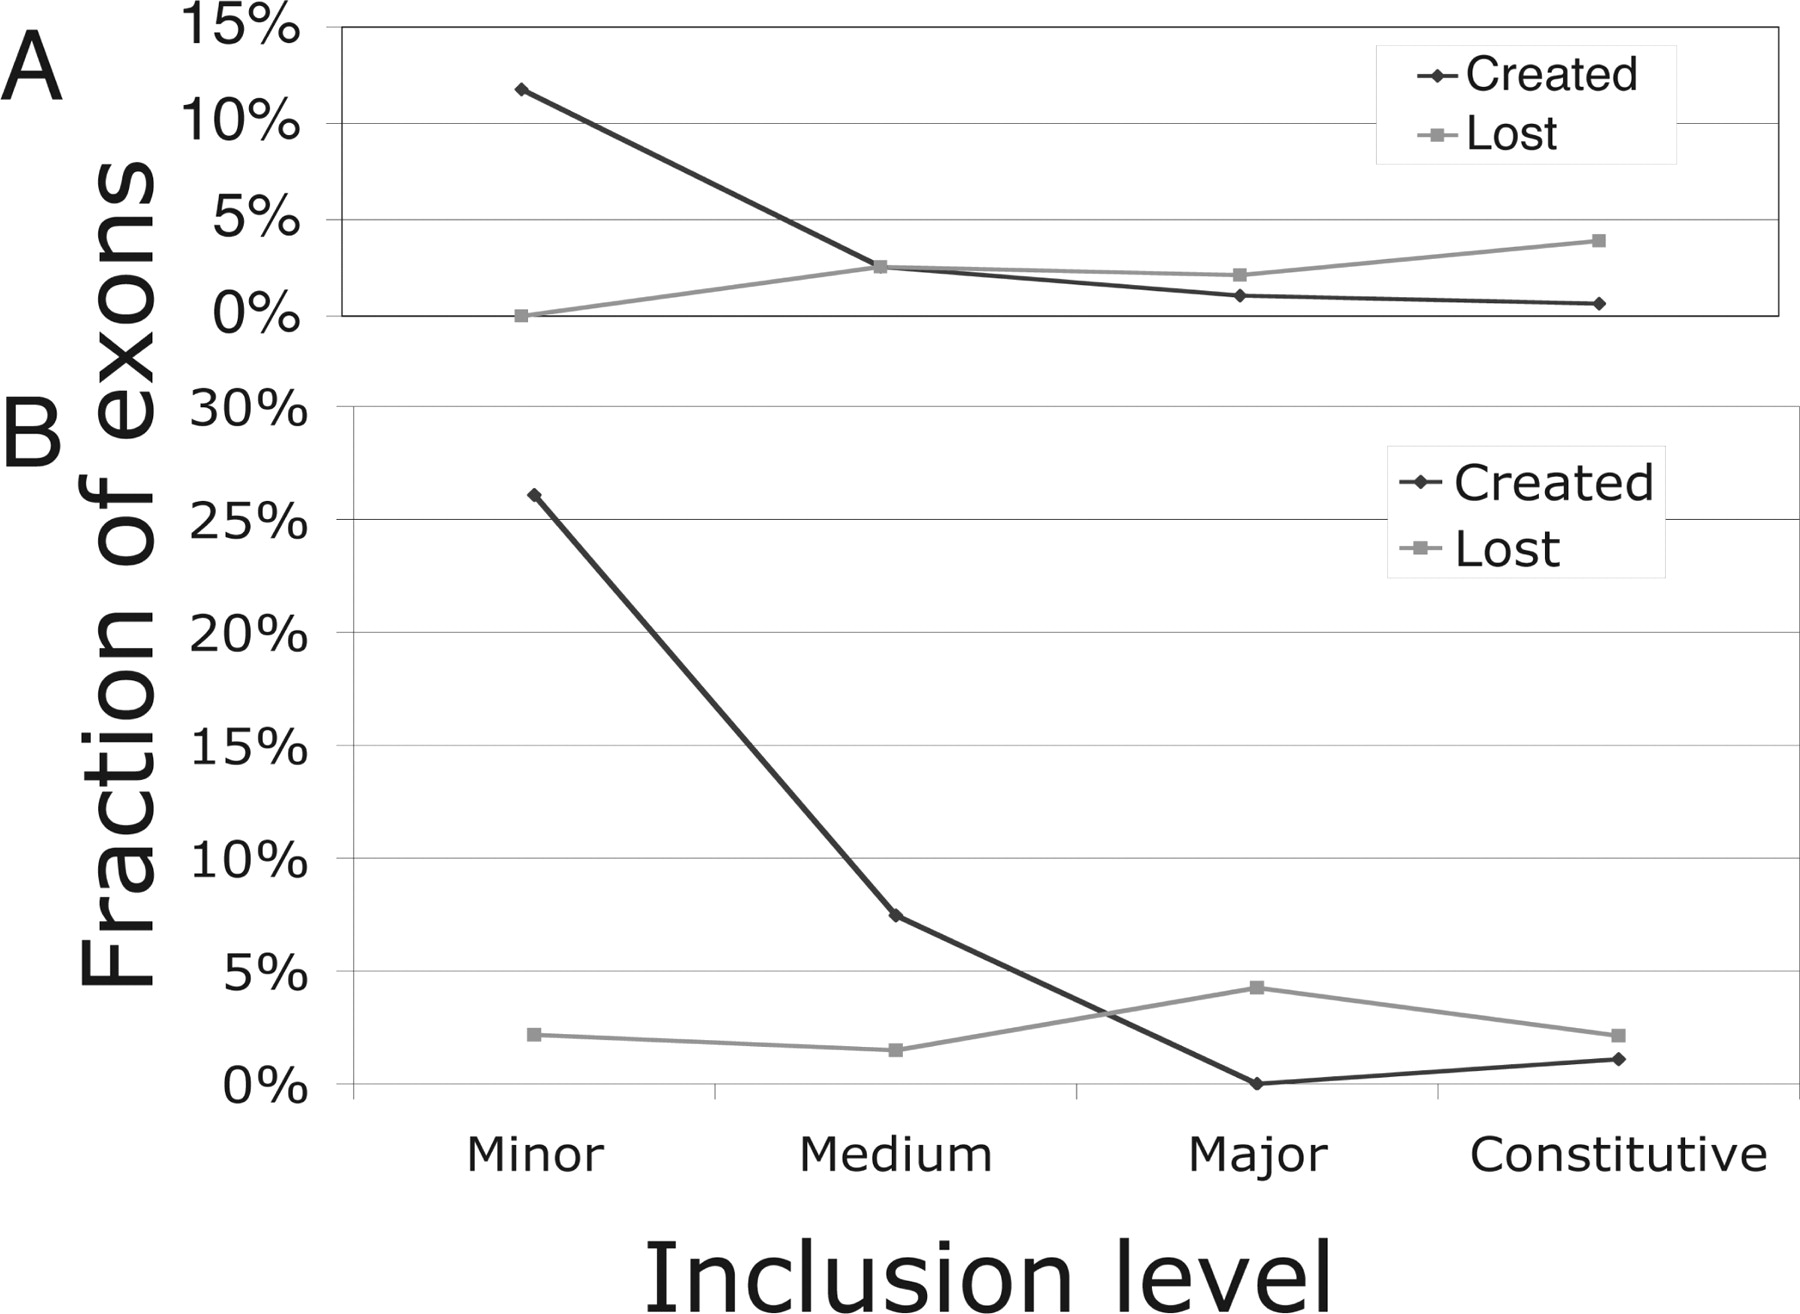
FIGURE 4.
Fraction of exons created and lost by inclusion category. The fraction of exons created (dark diamonds) or lost (light squares) after the split between (A) human–chimp and (B) mouse–rat in each of the four inclusion categories. The amount of loss is almost constant within time (5 my [A], 40 my [B]) and inclusion category. The amount of creation is anticorrelated with the inclusion level.




