


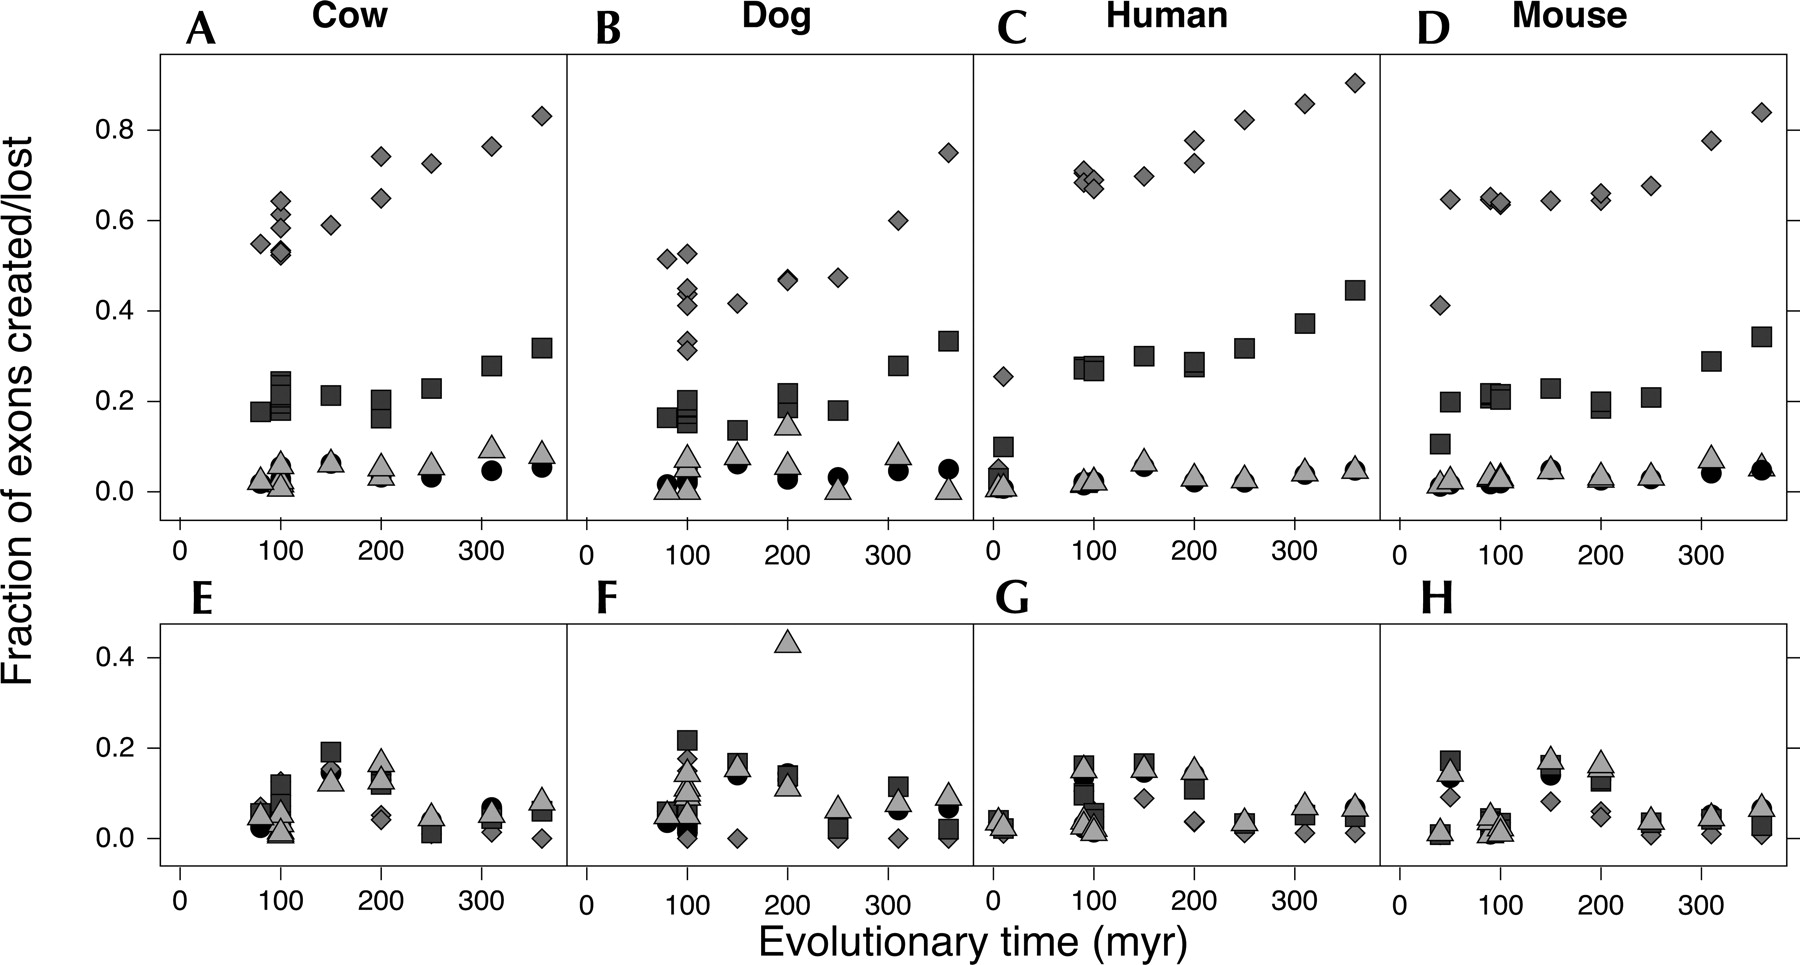
FIGURE 3.
Time course of exon creation and loss. The fraction of minor (light diamonds), medium (dark squares), major (light triangles), and constitutive (dark circles) created in cow (A), dog (B), human (C), and mouse (D) or lost (E–H, respectively) within the evolutionary distance. The amount of loss and creation in constitutive and major-form exons is the same, indicated by strong overlap of points on the graph. In the alternative set, the fraction of created exons is anticorrelated with the inclusion level. The amount of loss is similar for all times and inclusion categories. Similar trends are observed in data from different source organisms.




