


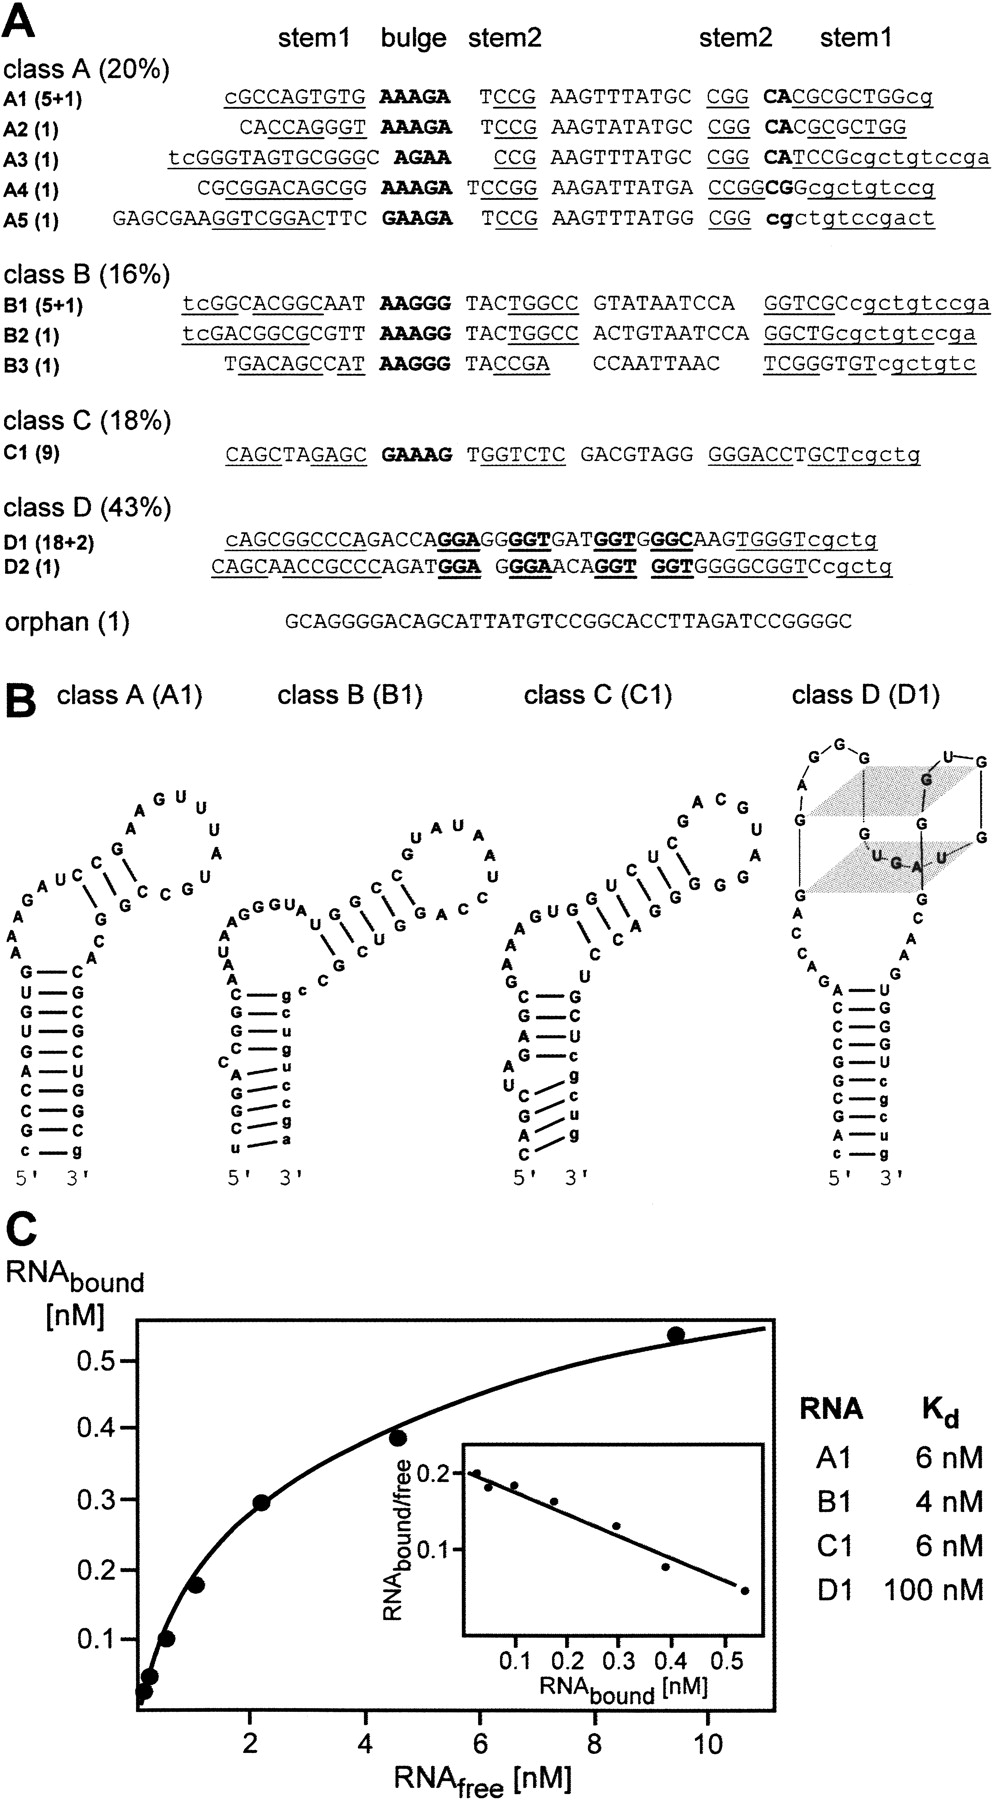
Classification of in vitro selected aptamer sequences. (A) Four aptamer classes were identified (A to D, relative abundances in parenthesis). The designation of each aptamer is followed by its clone abundance in parentheses (+n, additional n sequences with single-point mutations) and the primary sequence of the randomized region (capital letters). Complementary sequences corresponding to stems 1 and 2 are underlined. Lower-case letters implicated in stem–loop formation indicate sequences derived from the constant primer binding sites. A purine-rich stretch in classes A–C, a conserved CA/G sequence in class A, and four GGN repeats in class D are printed in bold. (B) Secondary structure models for the most abundant member of classes A–D are shown. Models are based on structure predictions using Mfold and sequence similarities to known G-quartet structures (Zuker 2003; Homann et al. 2006). (C) Determination of equilibrium dissociation constants (Kd). Representative binding isotherm for the binding of aptamer B1 to Rrm4GST. The inset shows a Scatchard plot of the binding data with the slope of the curve representing −1/Kd.




