


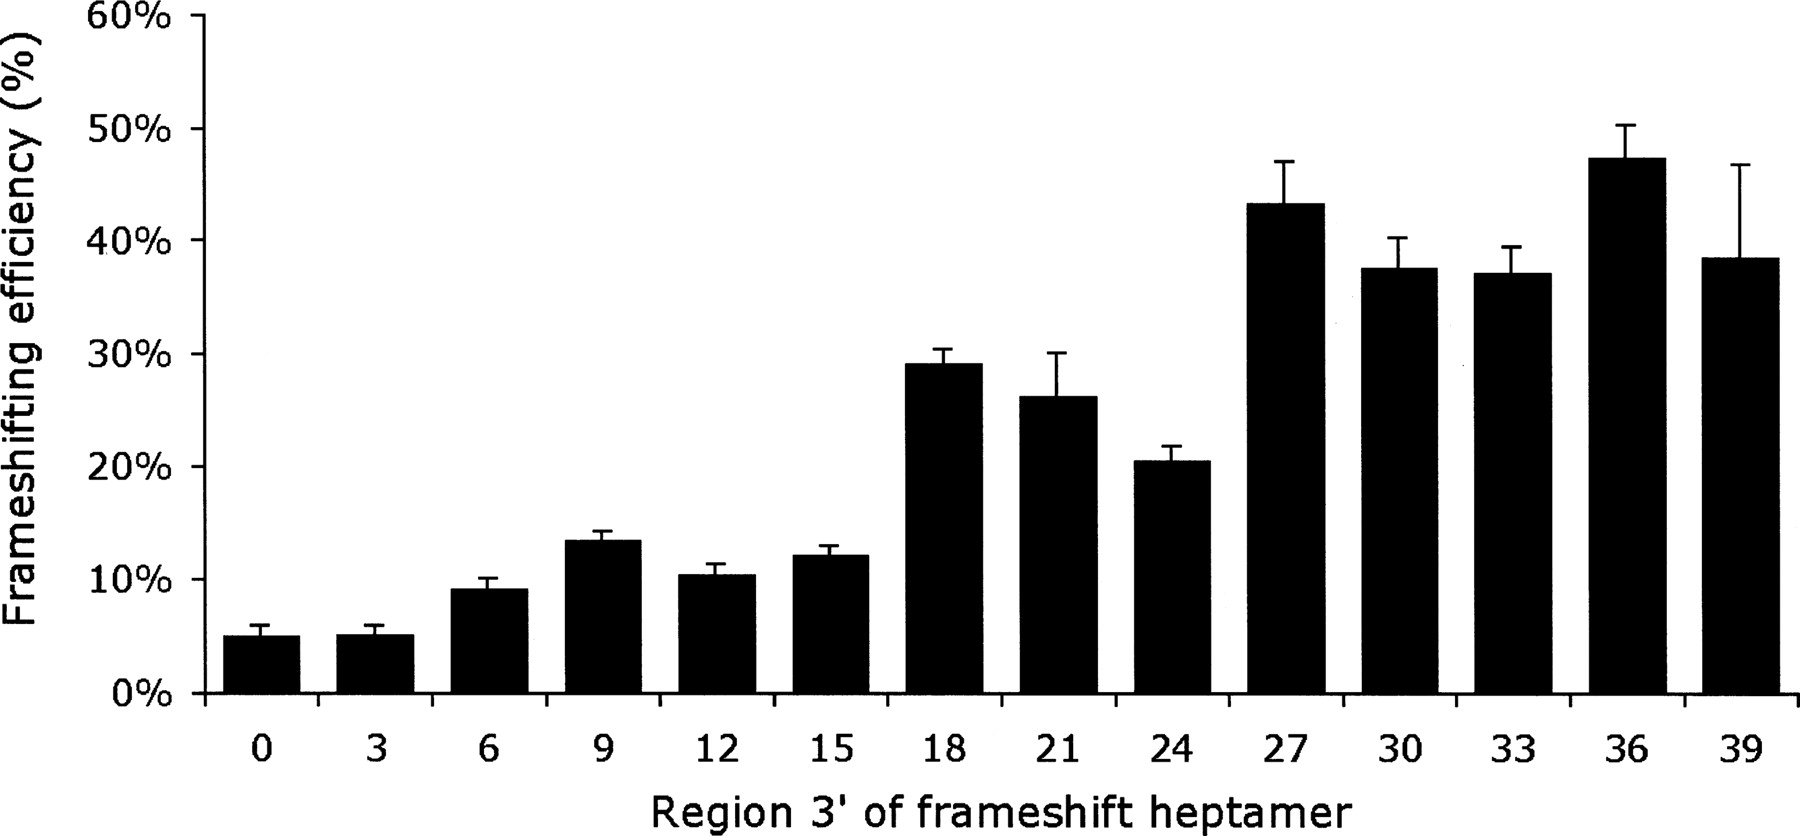
FIGURE 3.
Deletion mapping of the EST3 stimulator. Each bar represents the frameshifting efficiency, as in Figure 2, for one of a series of reporters that includes increasing amounts of the region downstream of the EST3 frameshift site.




