


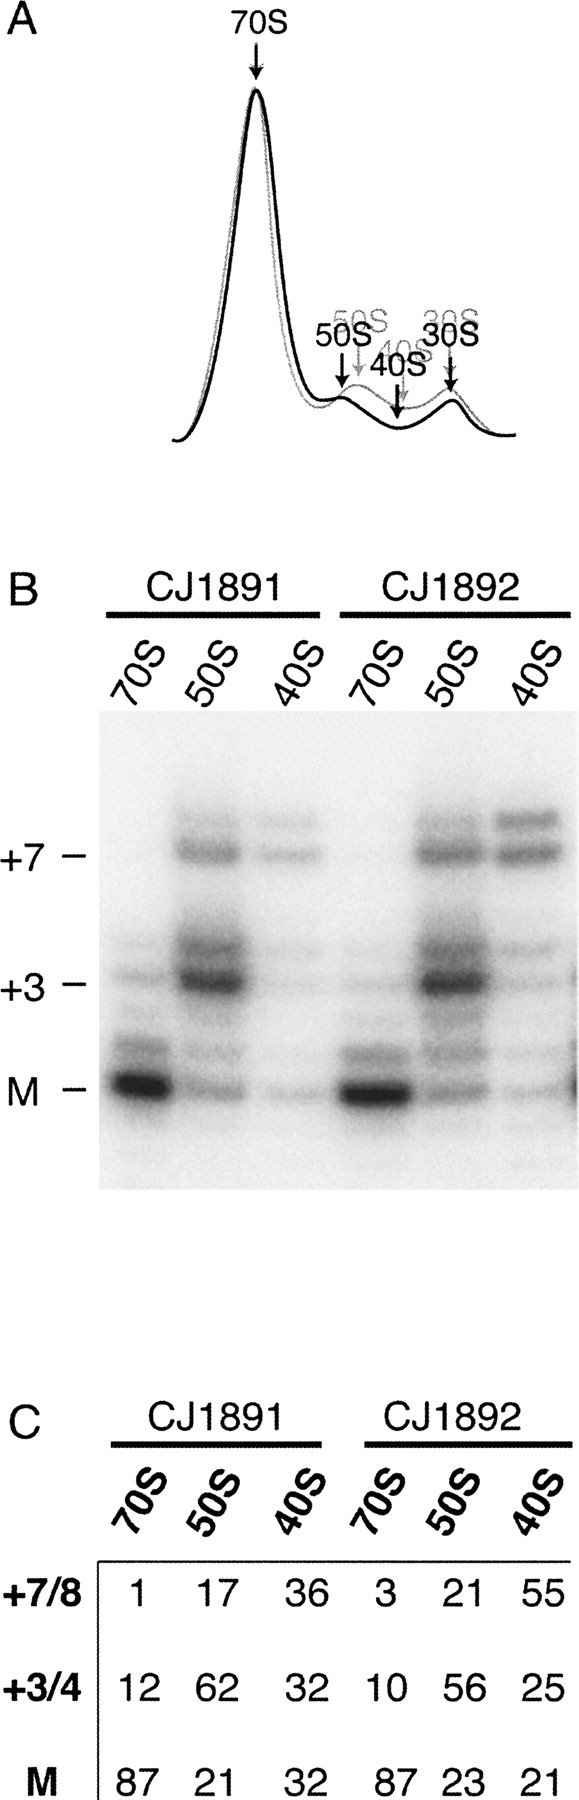
Ribosome profile analysis. (A) Superimposed images of the sucrose-gradient ultracentrifugation analysis of ribosome fractions derived from CJ1891 (black) and CJ1892 (gray). Each image is representative of three independent experiments. The positions of the 70S ribosomes, 50S large subunits, and 30S small subunits are indicated by arrows. Also indicated is the position corresponding to ∼40S, from which fractions were isolated for primer extension analysis. (B) Primer extension analysis. RNA was isolated from 70S, 50S, and 40S fractions, and analyzed by primer extension using probes specific for 23S rRNA. The positions of the mature (M), +3, and +7 products are indicated. (C) Quantitation of mature and immature 23S rRNA. The amounts of the mature, the +3/4, and the +7/8 products present in the fractions analyzed in B were quantified using ImageQuant software, and are expressed as the percentage of the radioactivity present in all three products.




