


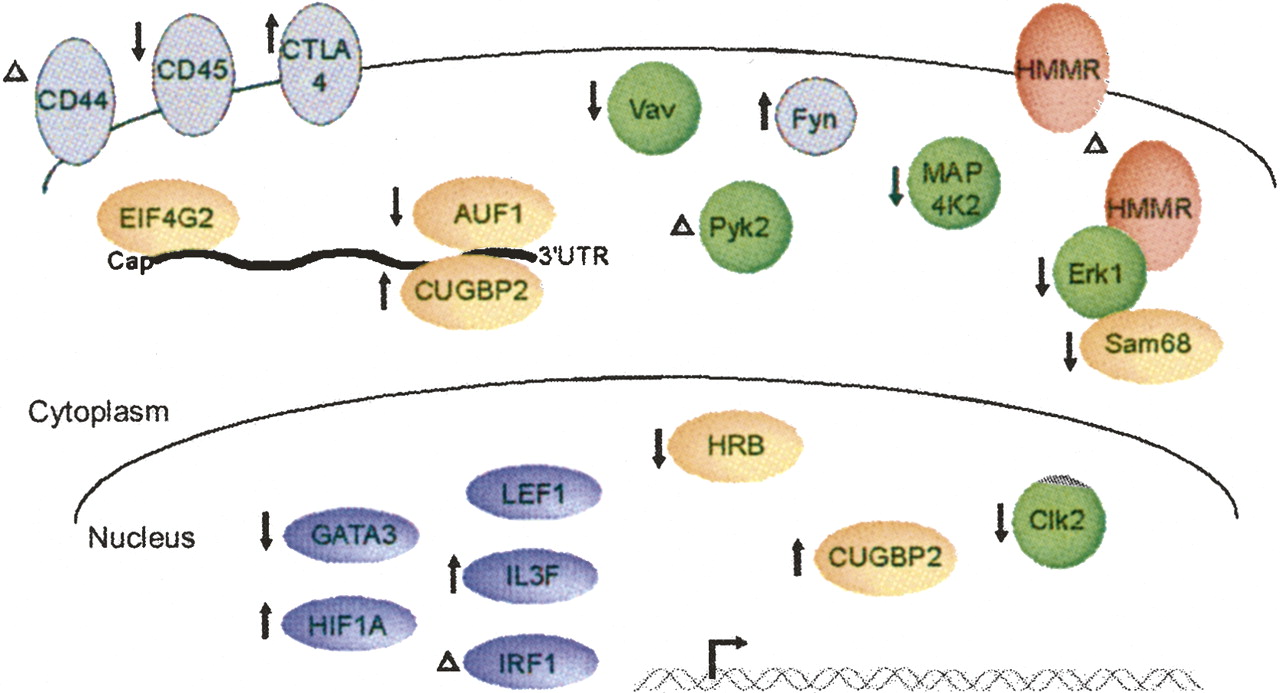
Model for the functions of AS during activation of human T cells. Schematic diagram of proteins affected by AS in T cells, as predicted by AS microarray profiling and confirmed by RT-PCR analysis of RNA from human CD4+ or CD8+ cells, and the predicted consequences. Color coding of proteins is as follows: green for kinases and signal adaptor molecules, orange for proteins involved in RNA metabolism, blue for transcription factors, pink for receptors, and gray for proteins shown in previous studies to be regulated by AS in T cells. The location of each proteins is shown according to its known functional role. These classifications are not precise as some proteins fit into more than one functional category and others are known to function in more than one location in the cell. Up and down arrows and Δ, respectively, indicate putative increase, decrease, or altered function of a protein as a consequence of AS upon T cell activation. See Supplemental Table 5 for further information.




