


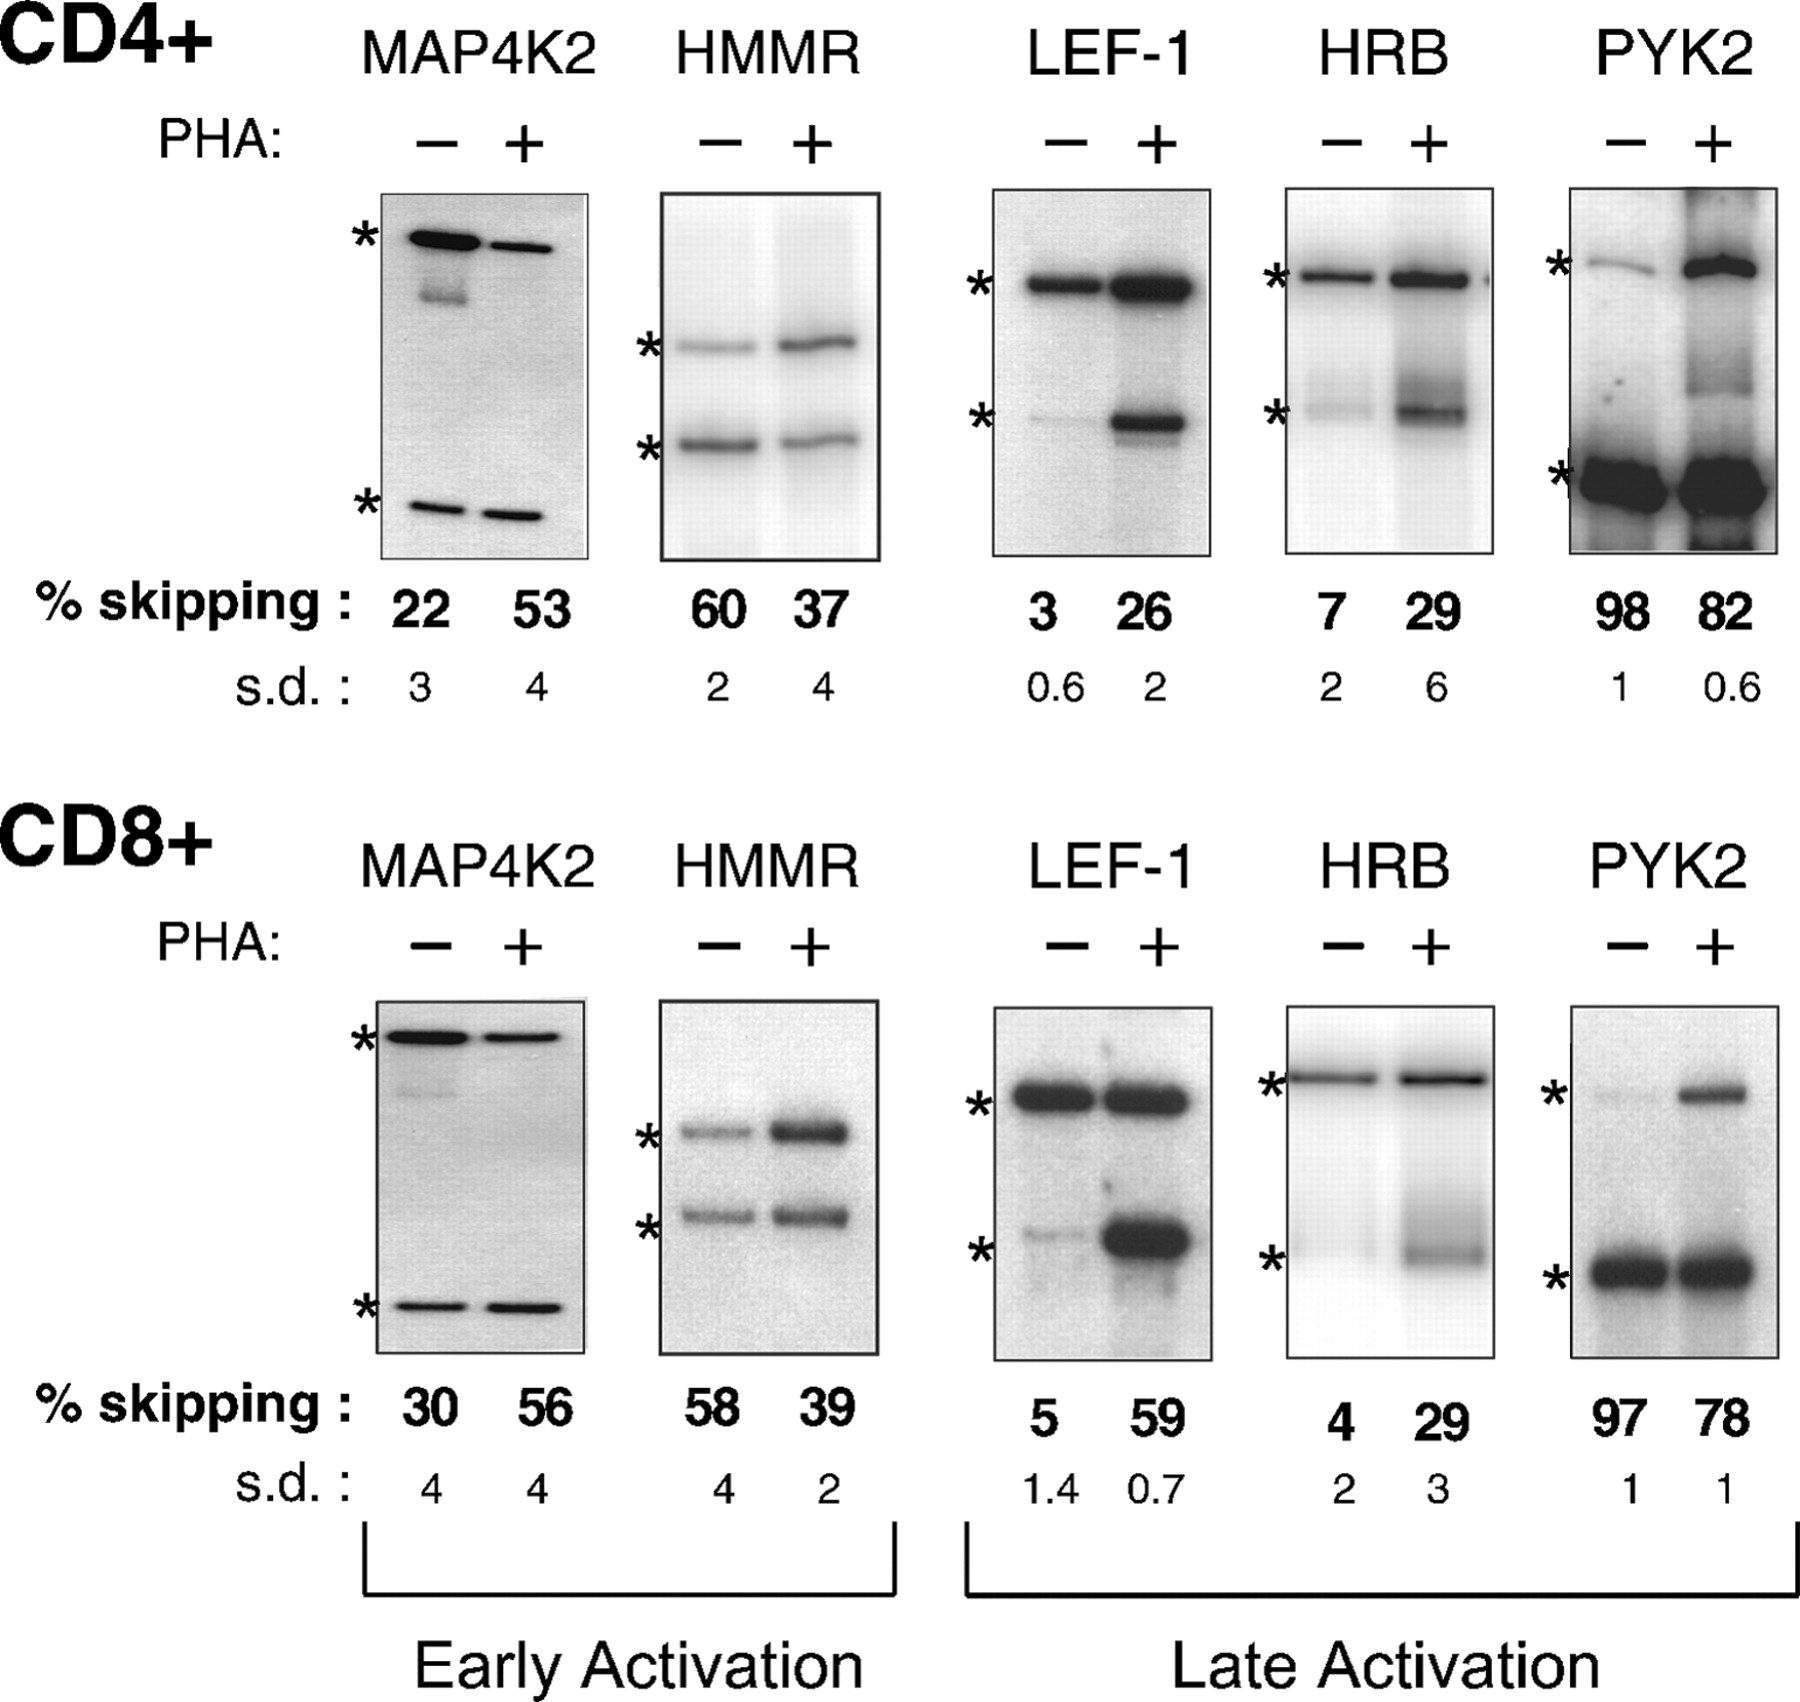
FIGURE 3.
Analysis of isoform expression in human CD4+ and CD8+ cells of genes predicted to undergo changes in AS upon stimulation. Representative RT-PCR assays performed using RNA isolated from CD4+ or CD8+ cells at either early or late time points after treatment with PHA, as described in Materials and Methods. Quantification and standard deviation (s.d.) from three to four experiments is shown. Numbers given indicate %exon skipping (i.e., exclusion). Asterisks indicate RT-PCR products derived from exon included and exon skipped isoforms.




