


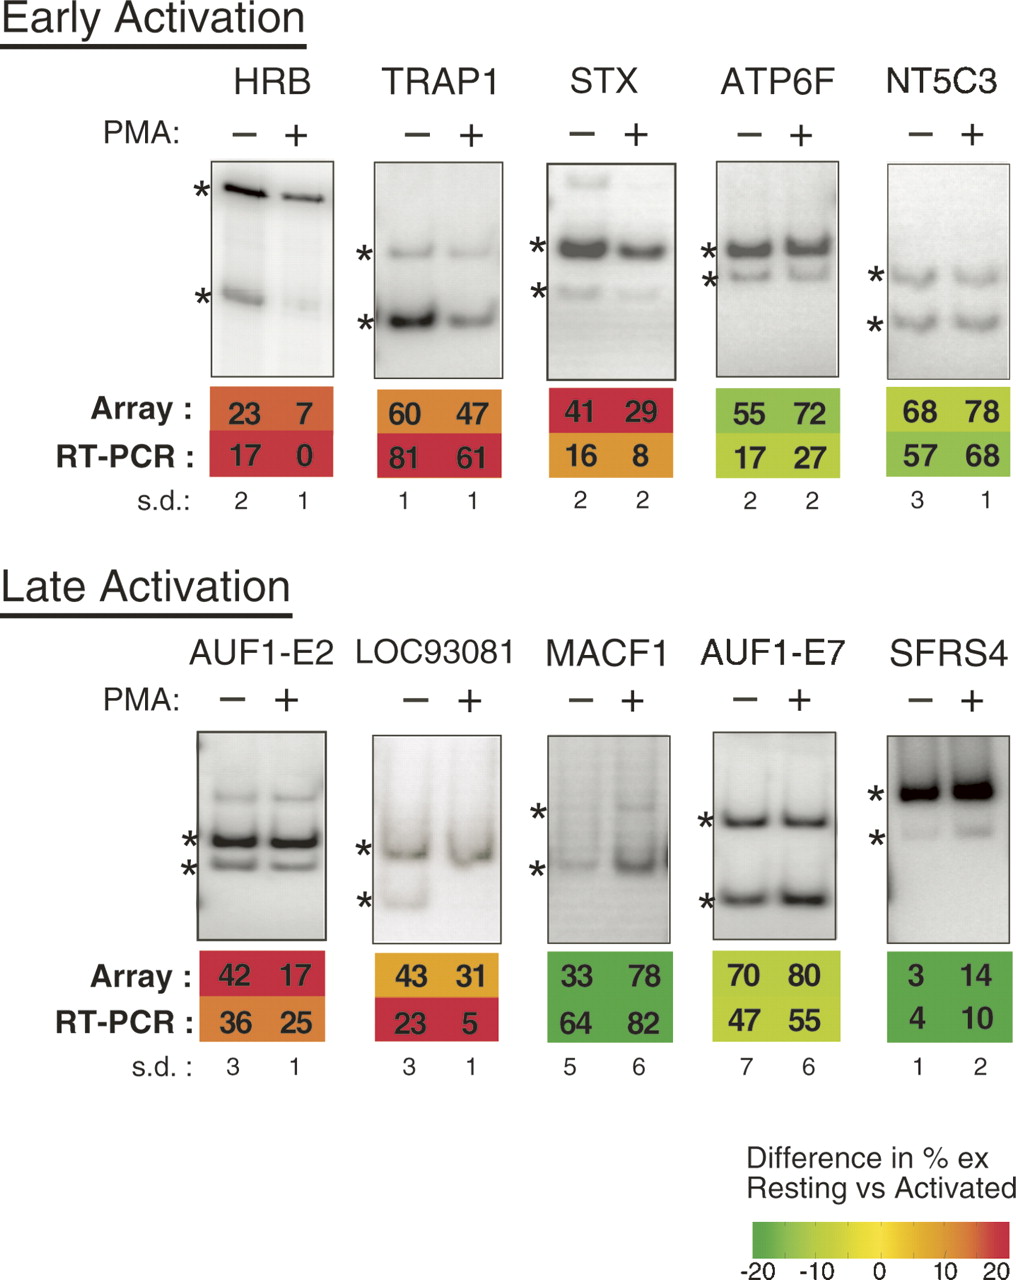
Analysis of isoform expression in Jurkat cells of genes predicted by microarray to undergo changes in alternative splicing (AS) upon stimulation. Representative RT-PCR assays performed using Jurkat RNA isolated at either early or late time points after treatment with PMA, as described in Materials and Methods. Quantification of %ex and standard deviation (s.d.) from three independent experiments are shown, along with the corresponding prediction from the AS microarray profiling data. Numbers given indicate %exon skipping (i.e., exclusion). Asterisks indicate RT-PCR products derived from exon included and exon skipped isoforms.




