


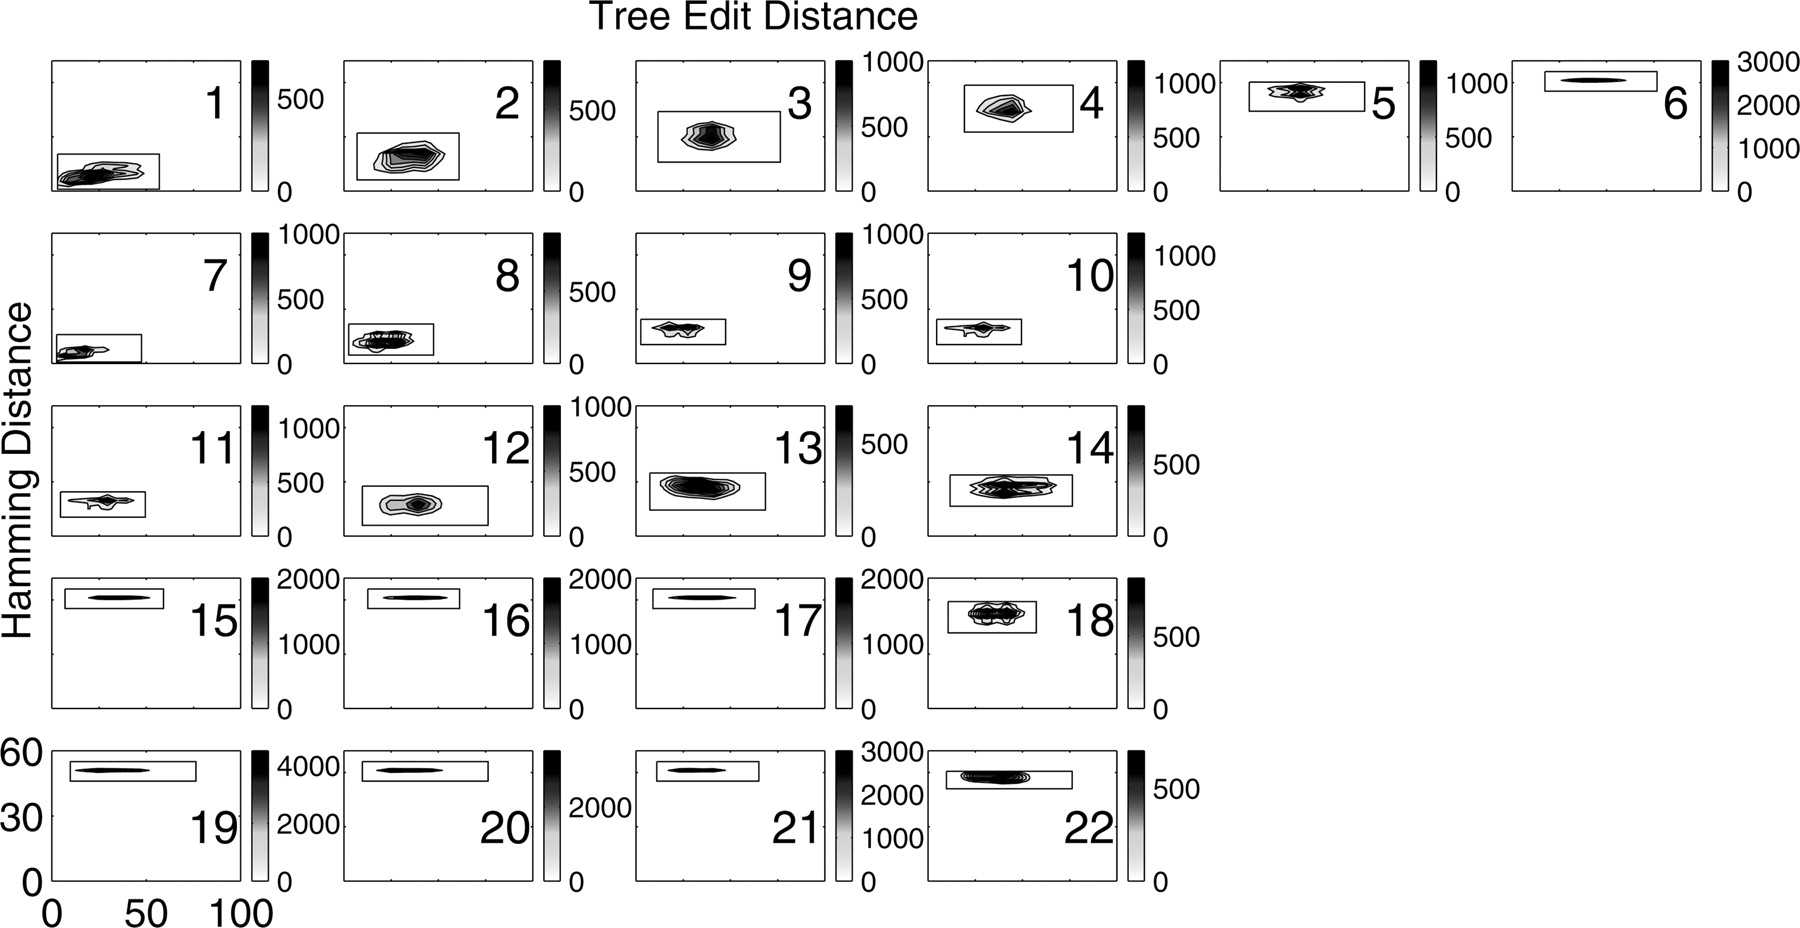
FIGURE 8.
Contour plots of sequence/structure relationships using Hamming distance versus tree edit distance for pools generated by 22 mixing matrices, starting from a modified P5abc domain (Fig. 3E). Note that the X and the Y axes are always 0–100 and 0–60, respectively, and that each intensity bar indicates the frequency of joint distance distributions (the frequency outside the box is 0). There are 10,000 sequences in each pool.




