


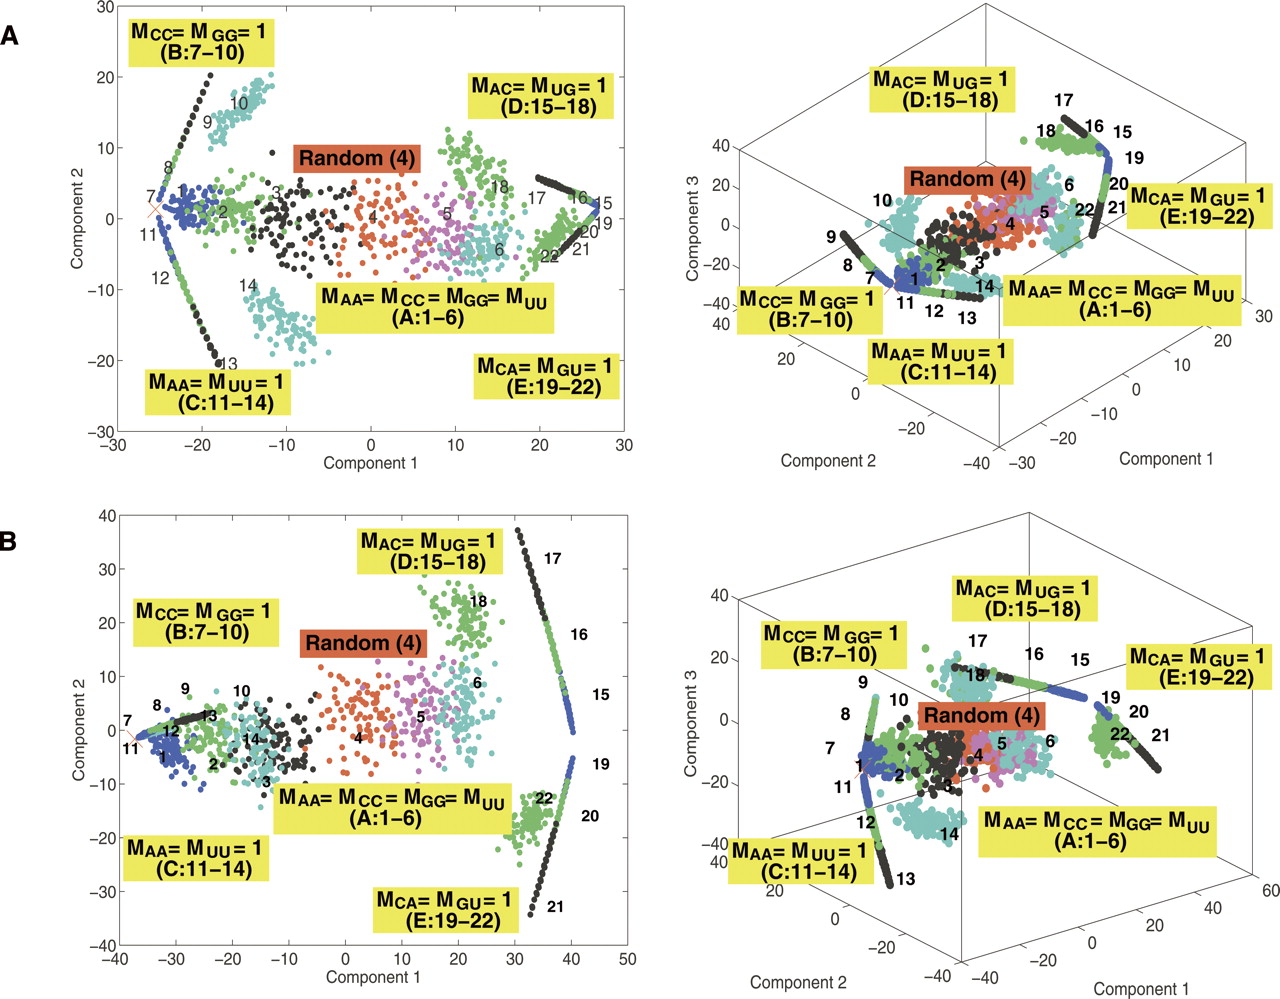
Two- and three-dimensional clustering plots using the MDS transformation for sequences generated from 22 mixing matrices (labeled 1–22) (A) starting with a modified P5abc domain (Fig. 3E) and (B) with 70S (Chain F) (Fig. 3A). The distance between any sequence pair is the Hamming distance, a measure of the number of dissimilar nucleotide bases. Axes represent two or three largest components of the projection. Each color represents a sequence pool generated by one of the 22 mixing matrices; the “×” mark on the left represents result for an invariant sequence transformation corresponding to diagonal matrix M ii =1. The mixing matrices are grouped into five classes (A–E) according to their matrix properties (Table 1).




