


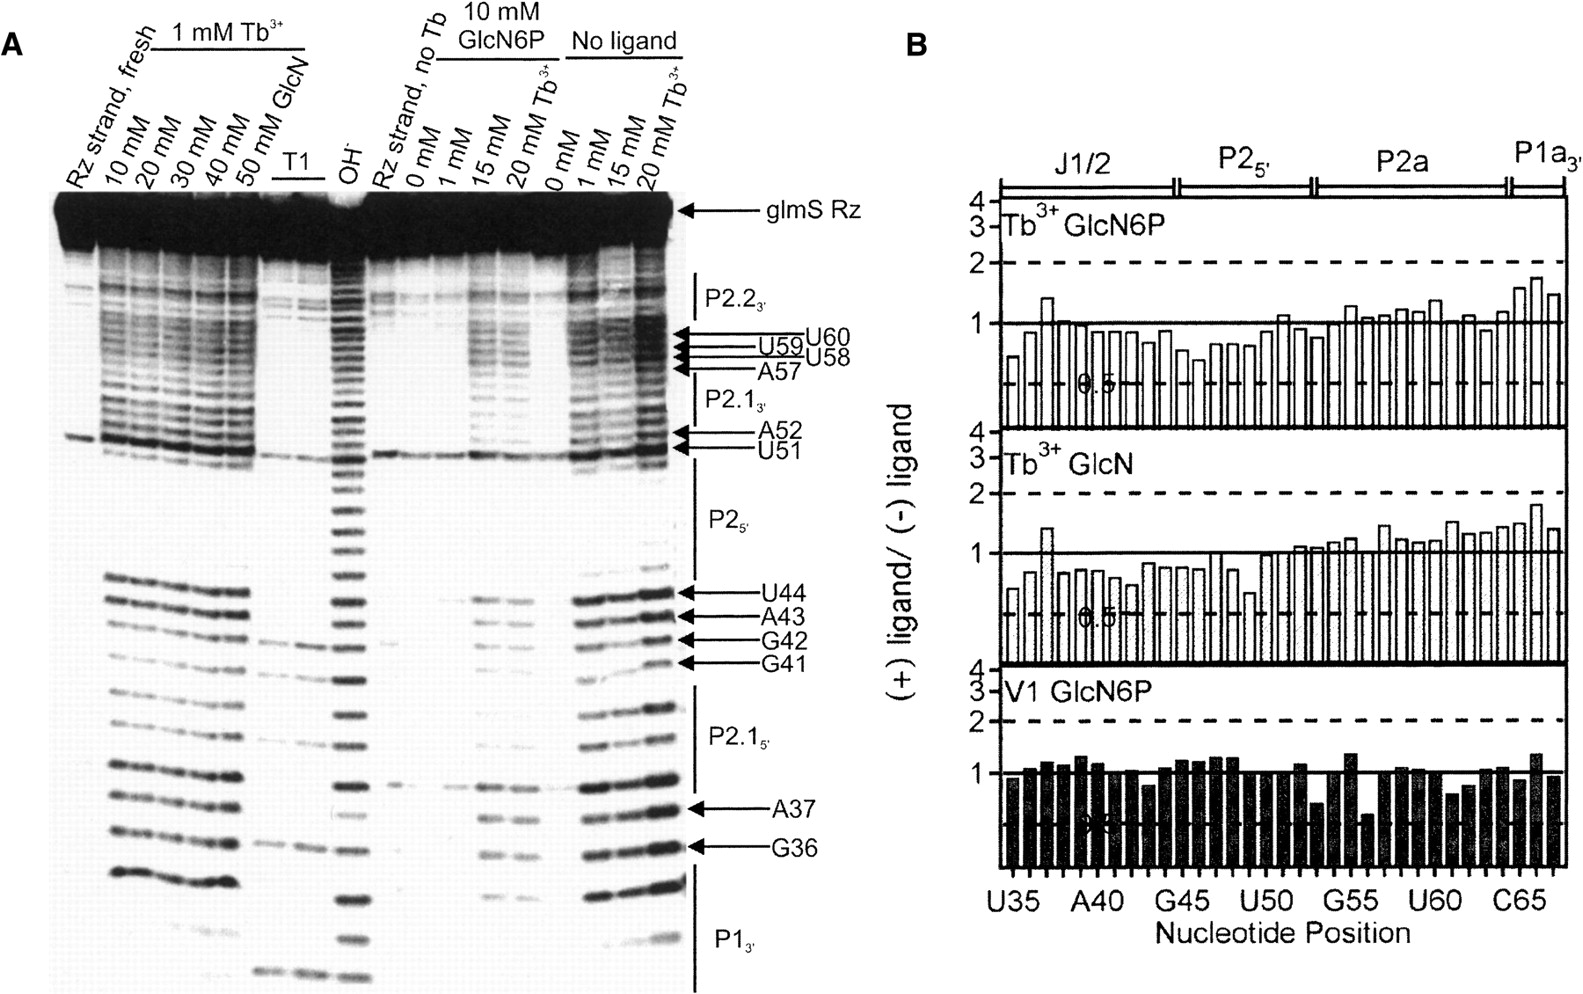
Footprinting of the trans-acting glmS ribozyme. (A) Terbium(III)-mediated footprinting of a 5′-32P-labeled glmS ribozyme strand upon incubation with Tb3+ for 2 h in 50 mM HEPES-KOH (pH 7.5), 200 mM KCl, and 10 mM MgCl2 at 25°C. From left to right are shown, as indicated; freshly labeled ribozyme strand without further incubation, footprint with 1 mM Tb3+ and increasing concentration of GlcN, RNase T1 digests, alkali (OH−) ladder, ribozyme strand incubated in buffer without Tb3+, footprint with increasing Tb3+ concentrations in the presence of GlcN6P, and footprint with increasing Tb3+ concentrations in the absence of ligand. (B) Histogram plots showing relative change in scission intensity from with ligand to without ligand, expressed as a ratio between the normalized intensities of scission (Π values, see Materials and Methods). The top panel represents terbium(III)-induced backbone scission in the presence (at 20 mM Tb3+) or absence (at 1 mM Tb3+) of 10 mM GlcN6P, the middle panel represents terbium(III)-induced backbone scission in the presence or absence of 20 mM GlcN (both at 1 mM Tb3+), and the bottom panel represents backbone scission by RNase V1 (0.0025 units) in the presence or absence of 10 mM GlcN6P. A ratio of 1 (continuous horizontal line) signifies no change in scission intensity.




