


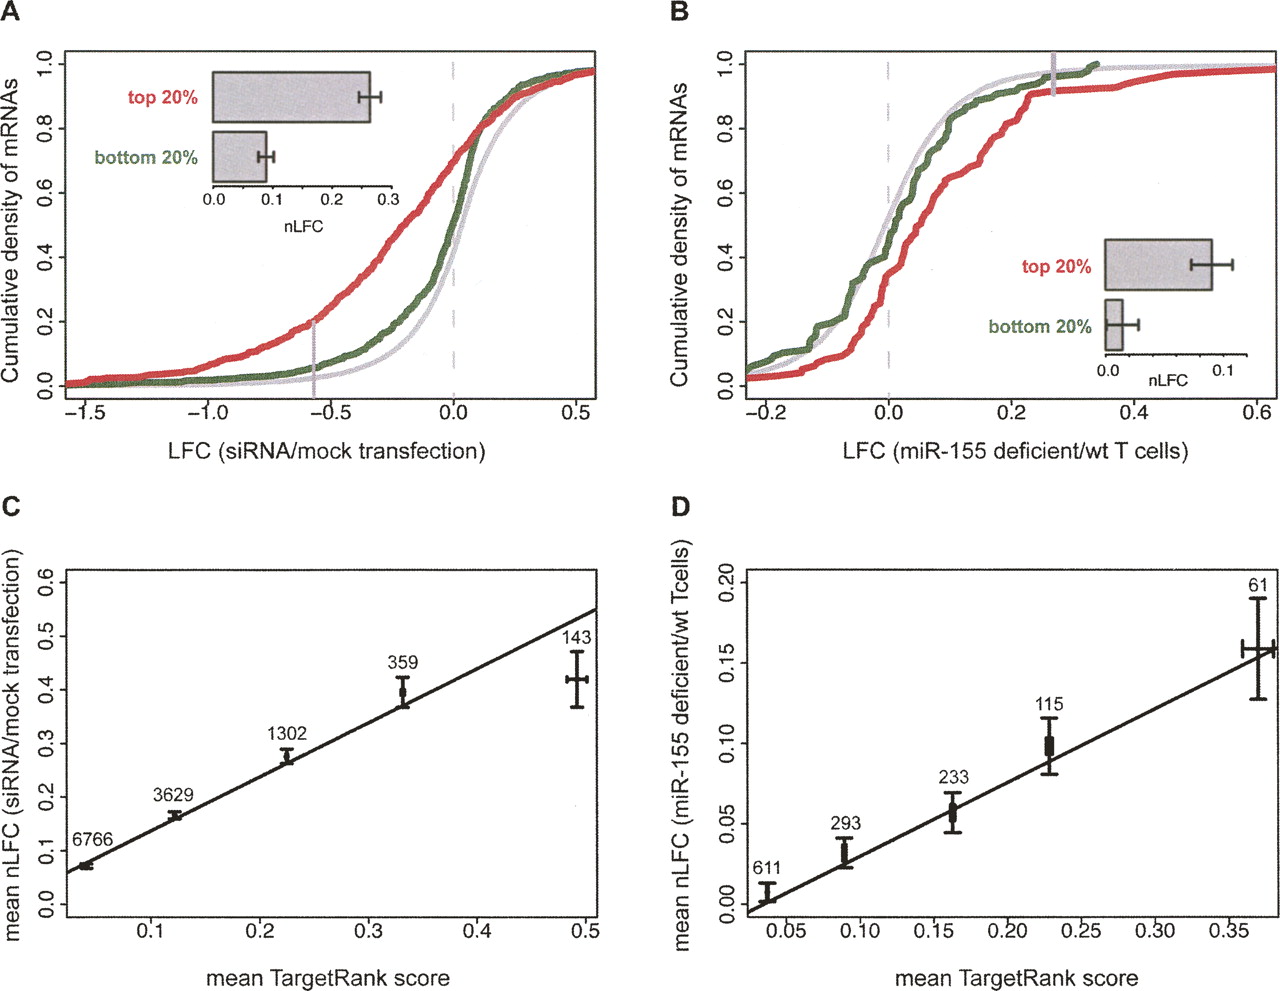
TargetRank scoring separates strongly and weakly down-regulated mRNAs. (A) CDFs of LFCs (as in Fig. 1) for the top 20% (red) and bottom 20% (green) of mRNAs to the relevant siRNA in the test set of eight randomly chosen siRNA transfection experiments ranked by TargetRank score. Only expressed mRNAs containing exactly one 7 mer seed match and no other seed matches of any type were used. For reference, the CDF for mRNAs lacking seed matches to the relevant siRNAs is shown (gray). (Solid vertical gray line) The LFC above which 97.5% of the no-seed-match mRNA set falls. (Inset bar plot) See Fig. 1. See Supplemental Table S7 for additional statistics. (B) Same as A, but for miR-155 knockout T cell data from Rodriguez et al. (2007). (C) All mRNAs containing seed matches (of any type or count) to the relevant siRNA in the eight test siRNA transfection experiments (same sets as in A) were scored using TargetRank. The mean TargetRank score and mean nLFC are plotted with standard error bars for mRNAs sets binned by TargetRank score (mRNA set sizes indicated above points). Line corresponds to least squares fit for entire data set (ANOVA P < 10−100); r = 0.23 (Pearson correlation). (D) Same as C, but for miR-155 knockout T cell data from (Rodriguez et al. 2007). Line corresponds to least squares fit for entire data set (ANOVA P < 10−18); r = 0.24 (Pearson correlation).




