


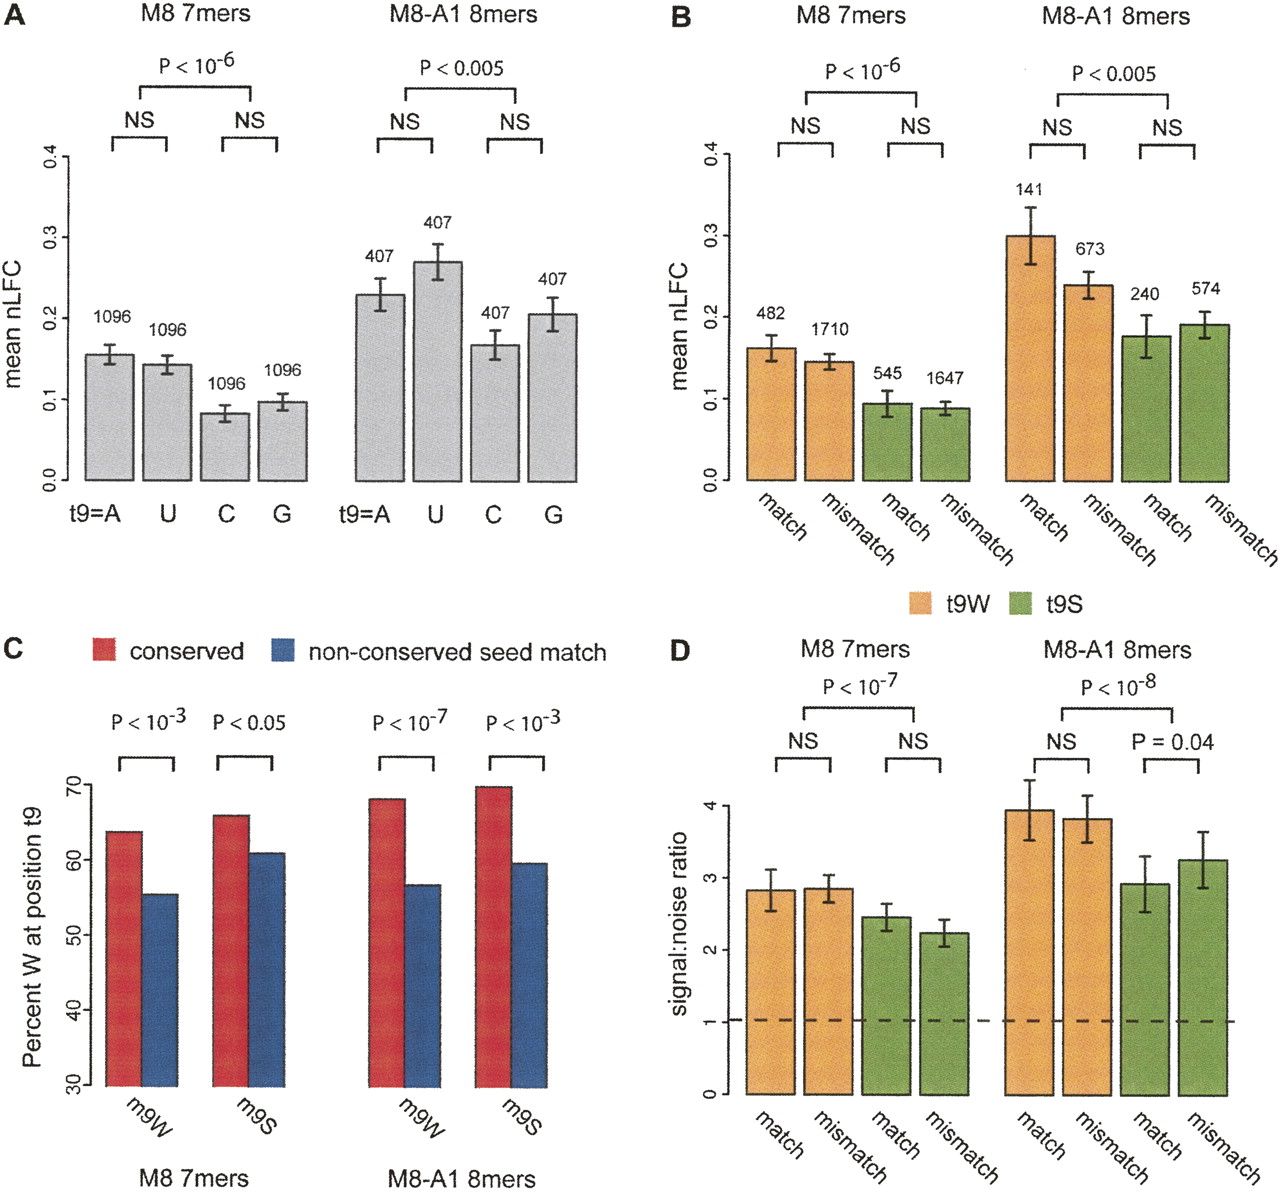
Increased down-regulation of mRNAs with adenosine or uridine at position t9. (A) Mean nLFC for mRNAs containing the indicated nucleotide at position t9 flanking siRNA M8 7 mer and M8-A1 8 mer (rank sum test P-values; NS = not significant at P-value cutoff 0.05). Error bars indicate standard error, and the numbers of mRNAs are indicated above the bars. Each mRNA contained exactly one seed match to any given siRNA (i.e., t9 sets are mutually exclusive), and mRNAs in each of the four t9 sets were controlled for 3′ UTR GC content. Other variables, such as mRNA expression, 3′ UTR conservation, or m9 composition, did not differ significantly between t9 sets. (B) Same as A, but reclassifying the controlled mRNA sets by whether the t9 base pairs with the siRNA m9 (match) or not (mismatch). (C) Enrichment of t9W nucleotides flanking conserved versus nonconserved miRNA M8 7 mer and M8-A1 8 mer in human 3′ UTRs (χ2 test P-values). The miRNA set consisted of conserved human miRNAs used for target prediction by Lewis et al. (2005) after removal of miRNAs with common m2–m8 seed regions but different m9 nucleotides, and pairs of miRNAs in the same superfamily. The nonconserved seed matches were sampled to match the seed match type, miRNA, and overall UTR CG content of the conserved set. (D) Mean signal:noise ratios for M8 7 mer and M8-A1 8 mer with t9W or t9S in match and mismatch configurations based on cohorts of control oligonucleotides (Lewis et al. 2005) matched for both count and exact CG content (error bars indicate standard deviation based on 14 control cohorts). (Dashed line) Baseline S:N value of 1. P-values based on Wilcoxon rank sum tests between indicated sets (NS = not significant at P-value cutoff 0.05).




