


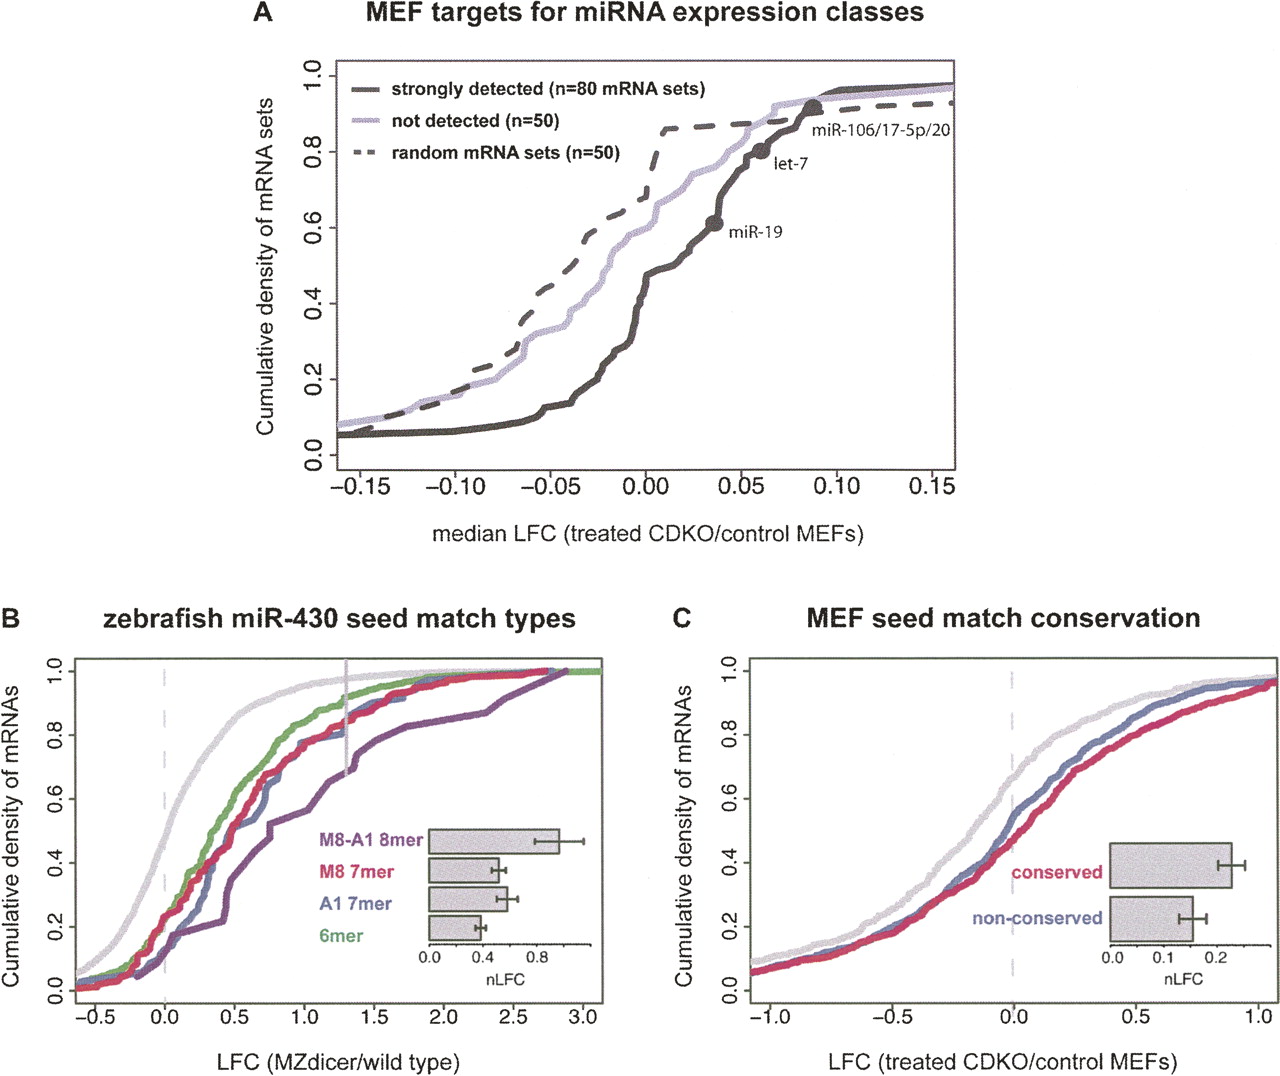
mRNA derepression following Dicer knockout varies with seed match type and conservation status. (A) CDFs of median LFC for three classes of mRNA sets. The expression classes were: (1) mRNA sets containing extended seed matches to the 80 miRNA families whose expression was detected above background by microarray (black curve, selected miRNA family names shown); (2) mRNA sets containing extended seed matches to the 50 miRNA families that were not detectably expressed (gray curve); (3) randomly selected mRNA sets (dotted line). Distributions of detected and nondetected sets are significantly different (P < 0.01 by rank sum test), but distributions of nondetected and random mRNA sets are not. (B) CDFs of LFCs for mRNAs containing the indicated miR-430 seed match types—or no miR-430 seed matches (gray curve)—for MZdicer zebrafish embryo data (Giraldez et al. 2006); only mRNAs with exactly one miR-430 seed match were included (seed match type mRNA sets are mutually exclusive). All seed match type LFC distributions differed significantly from the no-seed-match class (P < 10−7 by rank sum test), and the pooled extended seed match types differed from the 6 mer class (P < 0.01 by rank sum test). (Solid vertical gray line) The LFC below which 97.5% of the no-seed-match mRNA set falls. (Inset bar plot) LFC values for each seed match type, with error bars indicating standard error. (C) CDFs of LFCs for mRNAs containing conserved (red) or exclusively nonconserved (blue) extended seed matches, or no seed matches (gray) to the set of 31 “responsive” miRNAs in the CDKO MEF experiment (Supplemental Material). Seed match count, overall UTR conservation, and mRNA expression level were controlled between the sets. The distributions of mRNA with conserved and nonconserved seed matches are significantly different (P < 0.05 by rank sum test). See Supplemental Table S6 for additional statistics.




