


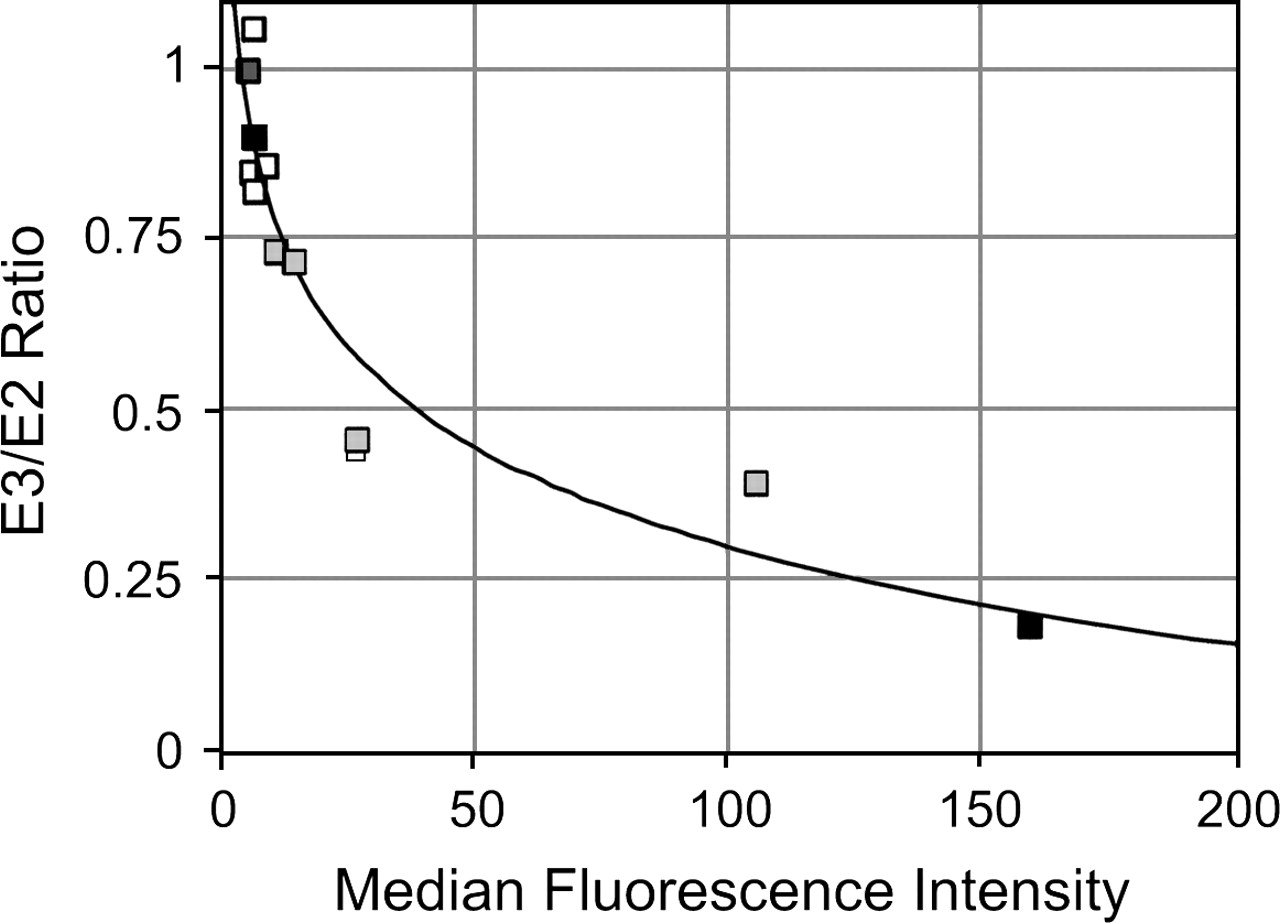
FIGURE 4.
Logarithmic relationship between exon skipping and GFP expression. RT-PCR data (E3/E2 ratio) and GFP expression (median fluorescence intensity) were plotted for the five compounds shown in Figure 2 (gray boxes), four other GFP-negative compounds (white boxes), and DMSO and PMA (black boxes), and fitted with a logarithmic equation (y = −0.47Log(x) + 1.25). The curve fit was initially done excluding DMSO and PMA, although the curve is essentially unchanged when these data are included (y = −0.48Log(x) + 1.26).




