


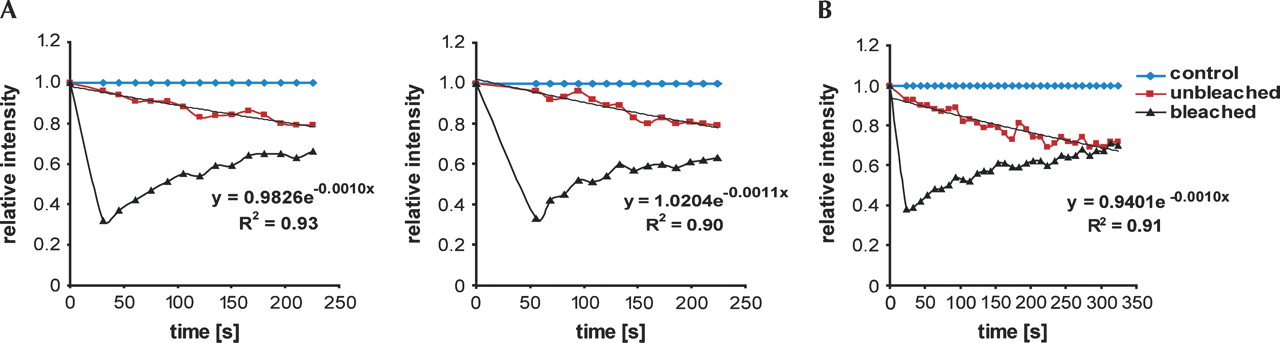
FIGURE 3.
Kinetics of Arx1p shuttling. (A) Graphs representing the fluorescence loss and recovery in the heterokaryon nuclei during the first bleach from two independent experiments. The fluorescence intensity was normalized to the intensity in the control nucleus. An exponential curve was fitted to the nonbleached nucleus and the calculated exponential function and correlation coefficient are shown. (B) As in A, but the heterokaryon was bleached only once and the fluorescence loss and recovery were followed until complete equilibration of the intensity in both nuclei.




