


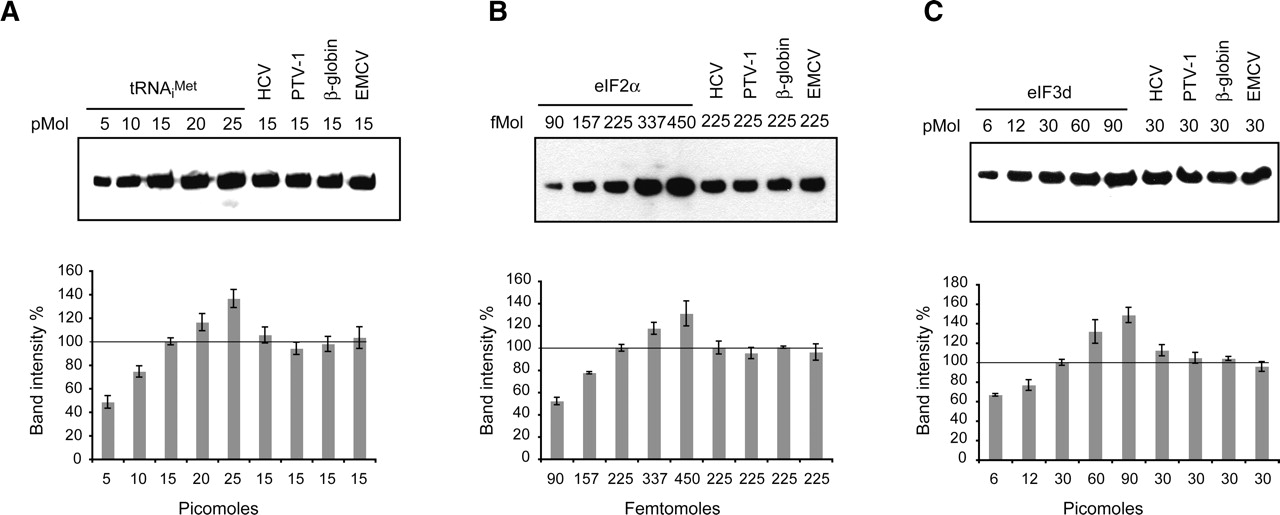
Quantitative analysis of 48S complexes. (A) Quantitative Northern blot analysis of purified 48S complexes using a probe specific to tRNAiMet. Dilutions of transcribed tRNAiMet (5–25 pMol) and 15 pMol of purified 48S complexes were loaded as indicated and resolved by 8% PAGE. Band intensities were quantified using ImageQuant software, and relative levels of tRNAiMet were normalized to that of the 15-pMol tRNAiMet intensity. A graphical representation of the relative intensities is displayed below. All error bars are standard error of the mean. Using a response curve analysis, the following tRNAiMet concentrations within the 48S complexes have been determined: 17.3 ± 1.5 pMol for HCV, 14.7 ± 1.3 pMol for PTV-1, 15.6 ± 1.5 pMol for β-globin, and 16.8 ± 2.1 pMol for EMCV. (B) Quantitative immunoblotting analysis of purified 48S complexes using antibodies specific to eIF2α. Dilutions of recombinant eIF2α (90–450 fMol) and 255 fMol of purified 48S complexes were loaded as indicated and resolved by 12% NuPAGE gel. Band intensities were quantified using ImageQuant software, and relative levels of eIF2α were normalized to that of the 225-fMol eIF2α intensity. A graphical representation of the relative intensities is displayed below. All error bars are standard error of the mean. Using a response curve analysis, the following eIF2α concentrations within the 48S complexes have been determined: 224.8 ± 16 fMol for HCV, 210.6 ± 14 fMol for PTV-1, 225.4 ± 3 fMol for β-globin, and 213.4 ± 21 fMol for EMCV. (C) Quantitative immunoblotting analysis of purified 48S complexes using antibodies specific to eIF3d. Dilutions of recombinant eIF3d (6–90 pMol) and 30 pMol of purified 48S were loaded as indicated and resolved by 12% SDS-polyacrylamide gels. Band intensities were quantified using ImageQuant software, and relative levels of eIF3d were normalized to that of the 30-pMol eIF3d intensity. A graphical representation of the relative intensities is displayed below. All error bars are standard error of the mean. Using a response curve analysis, the following eIF3d concentrations within the 48S complexes have been determined: 38.7 ± 4.2 pMol for HCV, 33.1 ± 4.0 pMol for PTV-1, 32.7 ± 1.5 pMol for β-globin, and 26,7 ± 3.6 pMol for EMCV.




