


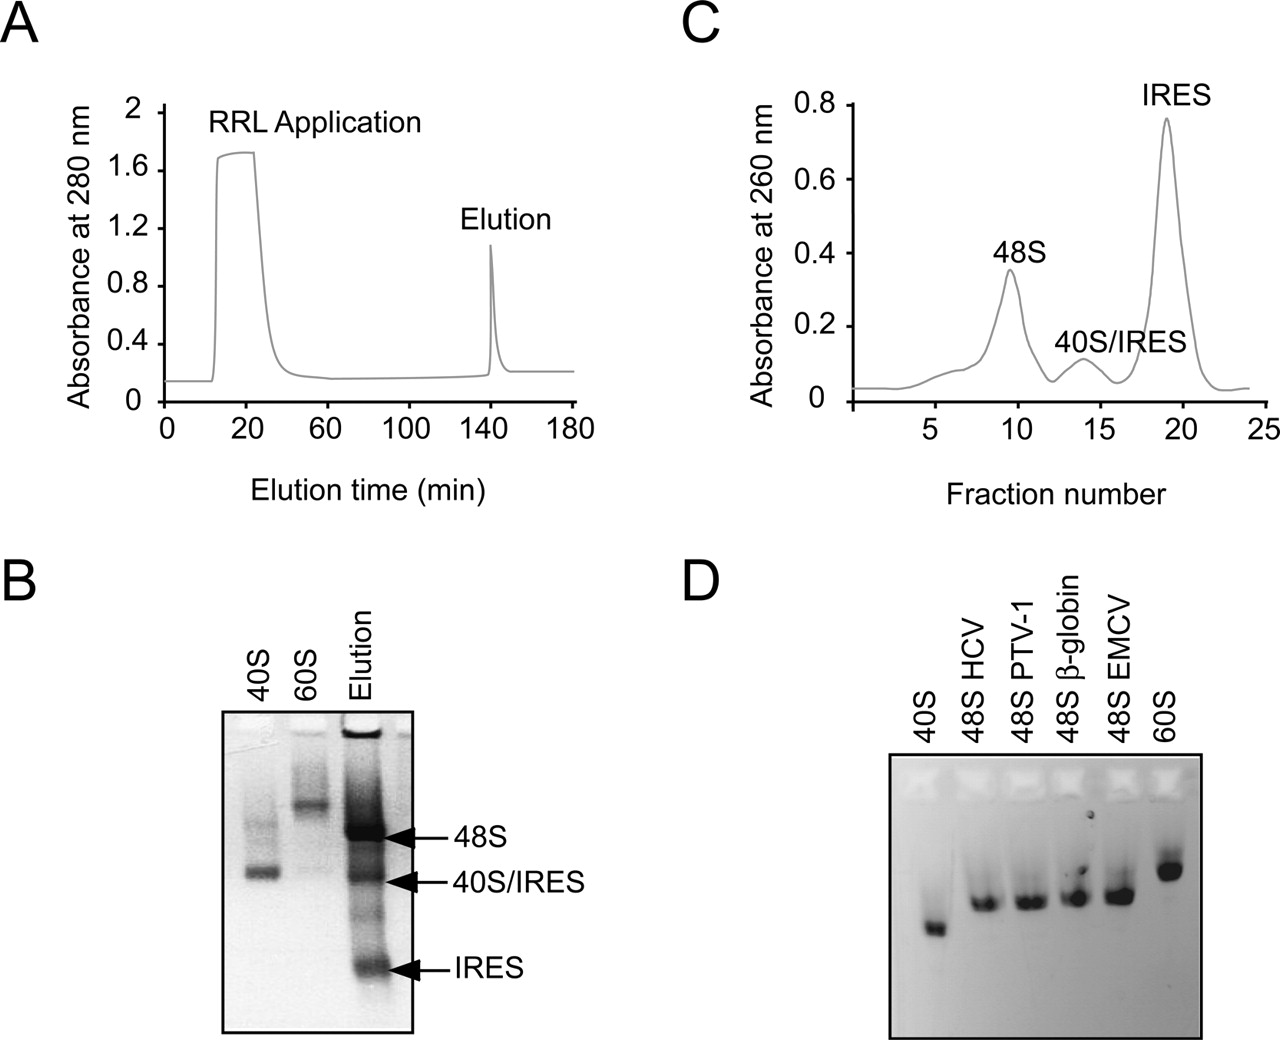
HCV IRES ribosomal 48S complex purification. (A) Profile of streptomycin affinity column. Plots of absorbance at 280 nm vs. elution time are shown. (B) Analysis of elution fraction composition by 1% native agarose gel. Lanes are loaded as noted on the gel. Bands corresponding to free RNA, RNA/40S binary, and 48S complex are indicated. (C) Sucrose density gradient analysis of translation initiation complexes bound to HCV IRES RNA. Plots of absorbance at 260 nm vs. sucrose density gradient fractions are shown; peaks corresponding to free RNA, RNA/40S binary, and 48S complex are indicated. (D) Analysis of the pooled and concentrated 48S fractions for all the assembled particles is shown on 1% native agarose gel. Lanes are loaded as indicated on the gel.




