


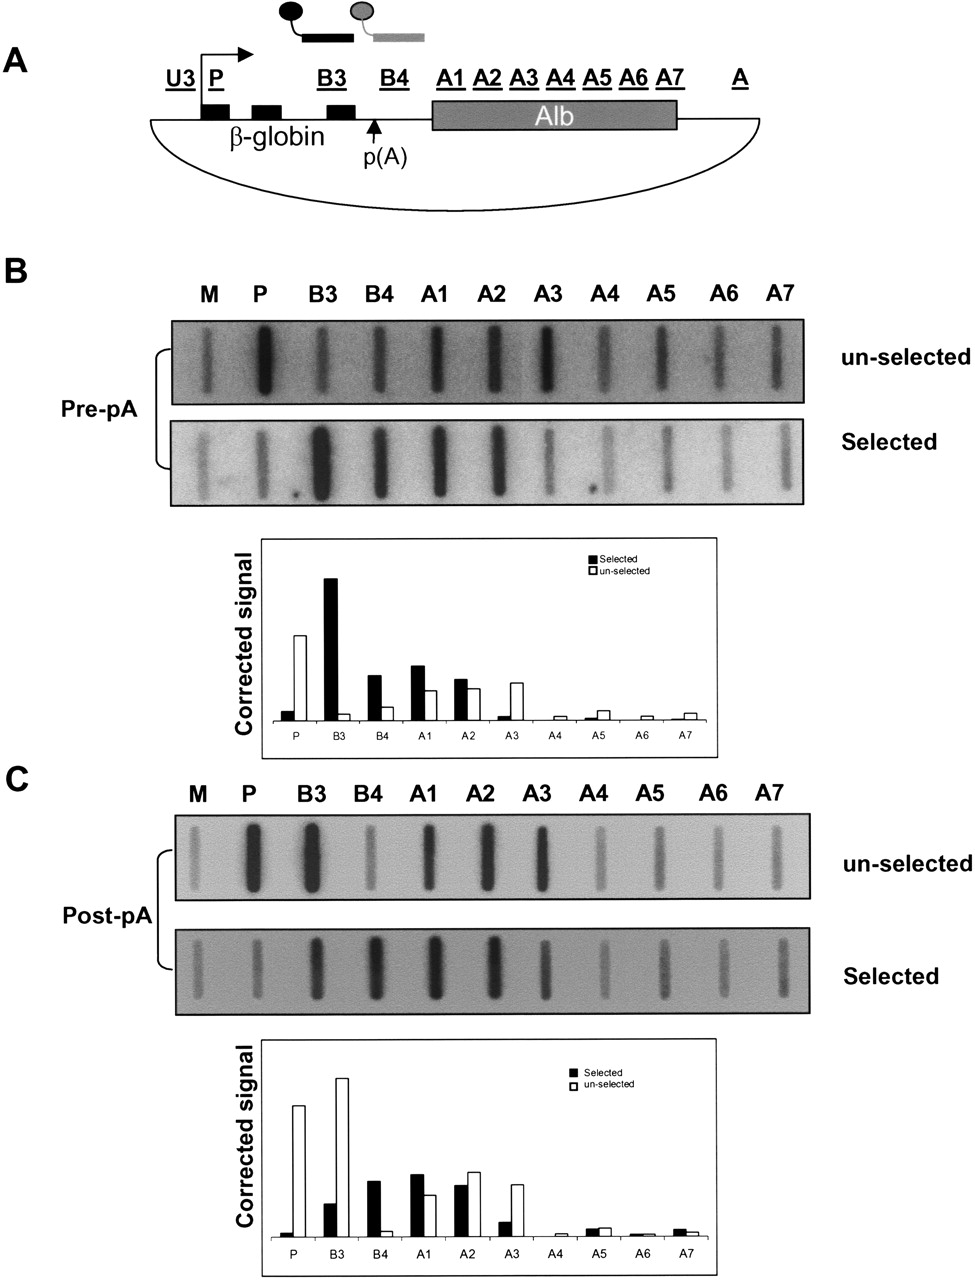
FIGURE 6.
Hybrid selection analysis of βAlb. (A) Diagram of βAlb showing the positions of the pre- and post-pA biotinylated selection probes (black line and connected circle, and gray line and connected circle, respectively). (B) Pre-pA site selection of βAlb transcripts showing selected and unselected fractions. Probes are indicated. Quantitation is shown in the graph. (C) Post-pA site selection of βAlb transcripts. Again selected and unselected fractions are shown. Probes are indicated and quantitation is shown in the graph.




