


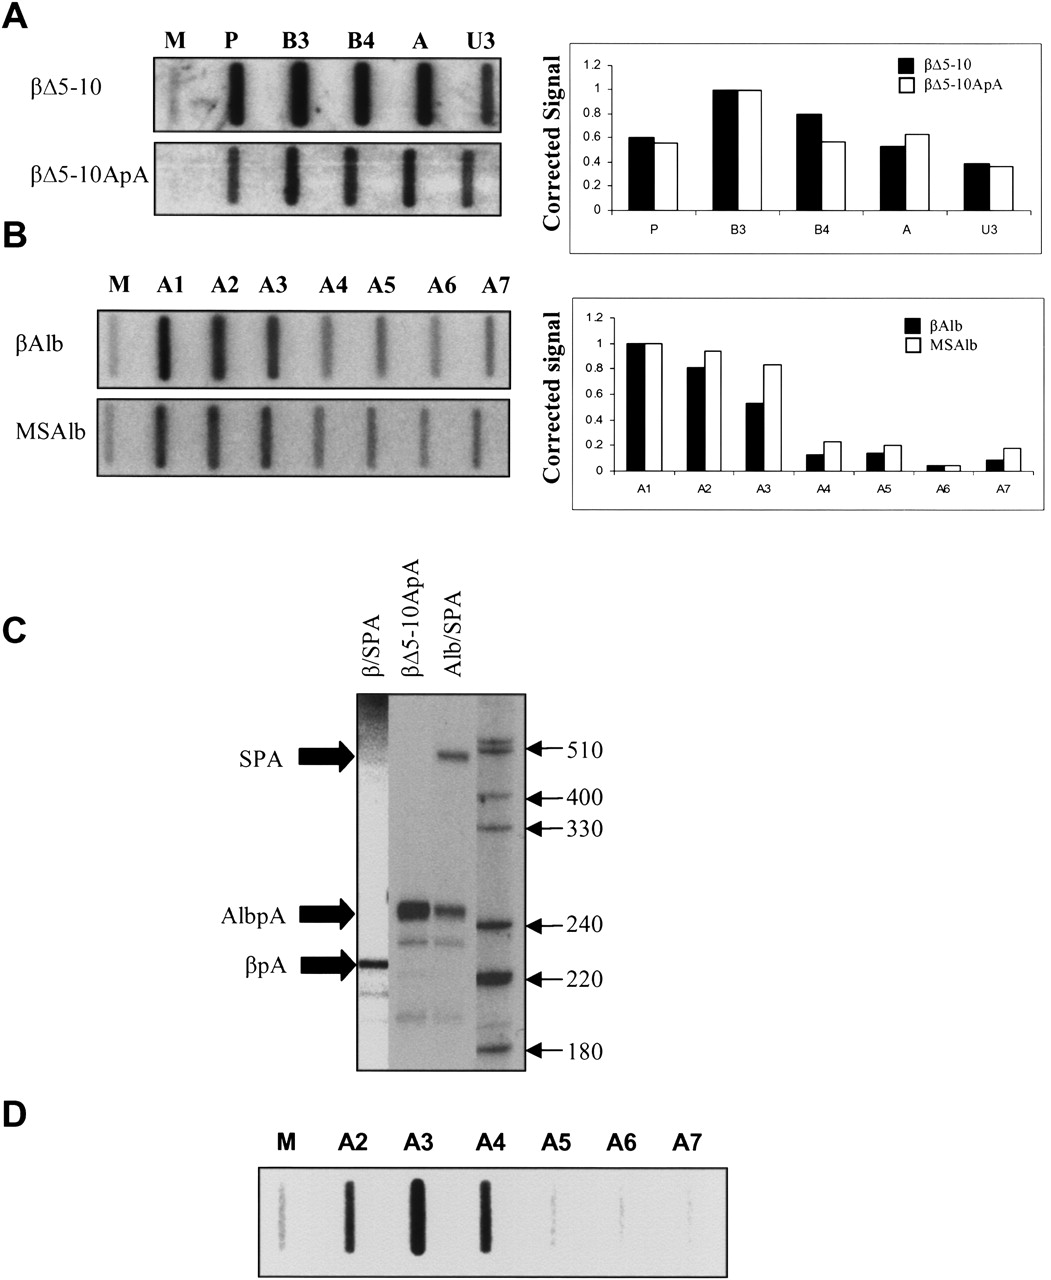
FIGURE 5.
(A) NRO analysis of βΔ5–10 and βΔ5–10ApA. Probes are indicated above their respective slots. Accompanying quantitation is also shown. (B) NRO analysis of βAlb and MSAlb. Probes are indicated above their respective slots. Accompanying quantitation is also shown. (C) Poly(A) site competition assay: Constructs used are indicated above their respective lanes, and various products are indicated by black arrows on the left-hand side. Size markers are also shown. (D) NRO analysis of transcription over the endogenous MSA 3′ flank using the HEPA1–6 cell line. Probes are indicated above their respective slots.




