


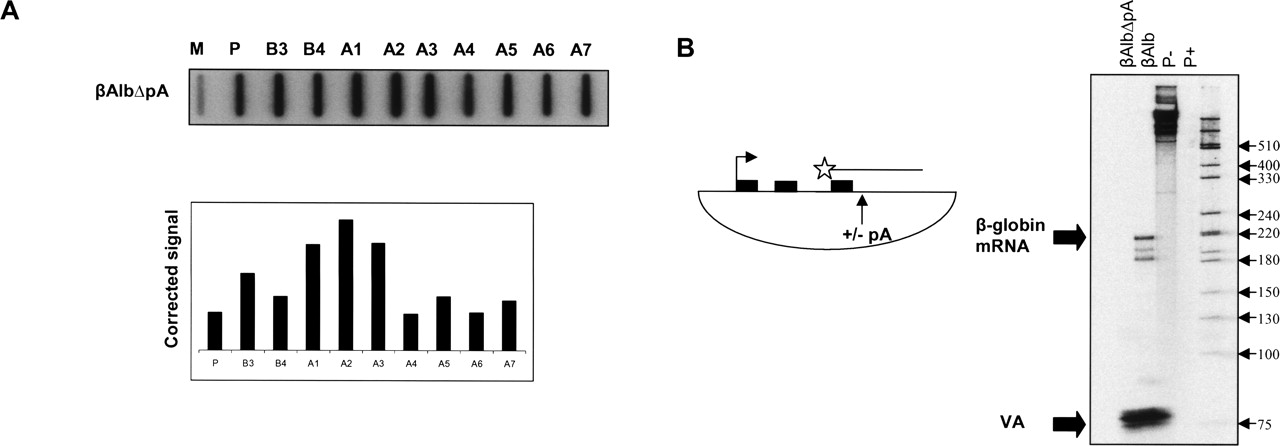
(A) NRO analysis of βAlbΔpA: High signal is observed over all probes relative to background (again, M). Graph shows above-background hybridization signals. (B) S1 analysis of poly(A) site cleavage: Position of S1 probe (star and line) is shown in the diagram. It spans the final exon of β-globin and the poly(A) site. β-Globin and VA specific signals are indicated by arrows. The triplet band pattern obtained in βAlb for the β-globin poly(A) site reflects some over digestion by S1 nuclease at this AT-rich 3′–end sequence in addition to cleavage at an upstream, cryptic, poly(A) site. P– and P+ are control lanes showing probes either undigested or digested with S1 nuclease, respectively.




