


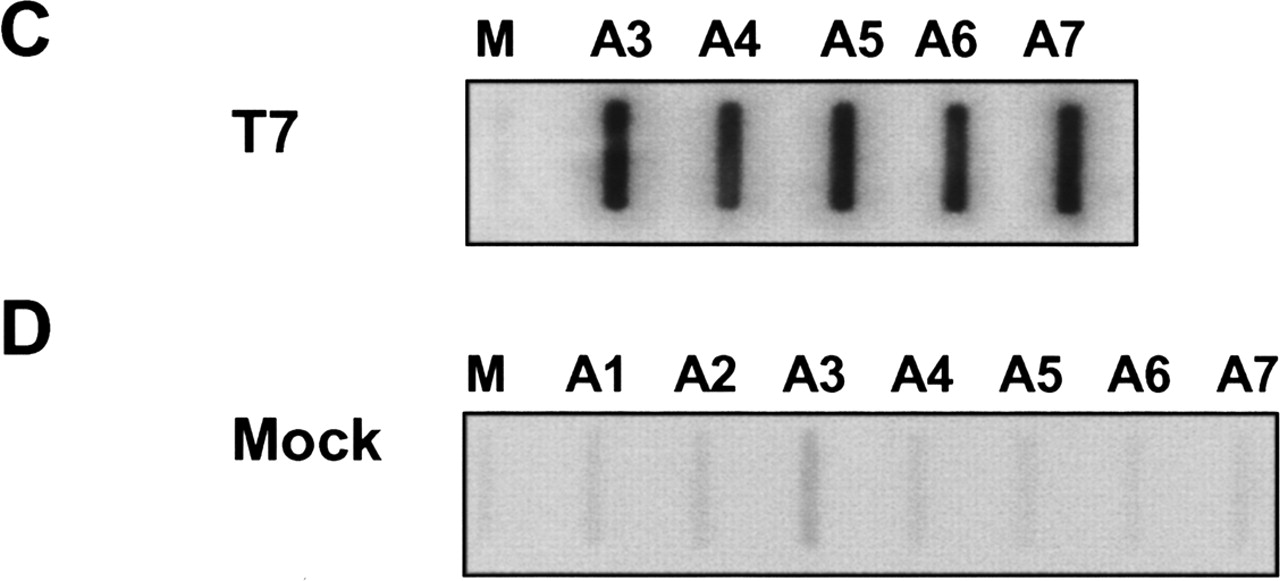
(A) Diagrammatic representation of the βAlb plasmid used for transient transfection-based analysis of transcriptional termination. β-Globin exons (black boxes) and intervening introns are followed by the poly(A) site and MSA 3′ flank (gray box). NRO probes (underlined) are above their positions on the plasmid. Construction of each probe is described in Materials and Methods. A scale bar is provided showing approximate distances from the β-globin poly(A) site. (B) NRO analysis of βAlb: The M slot represents background hybridization to single-stranded, empty M13 vector. Hybridization signals are shown below their respective probes. Graph shows above-background hybridization signals. (C) Hybridization of synthetic MSA 3′ flanking region transcript to probes A3–A7. (D) NRO analysis of mock transfected HeLa cells. All probe signals are close to background (M).




