


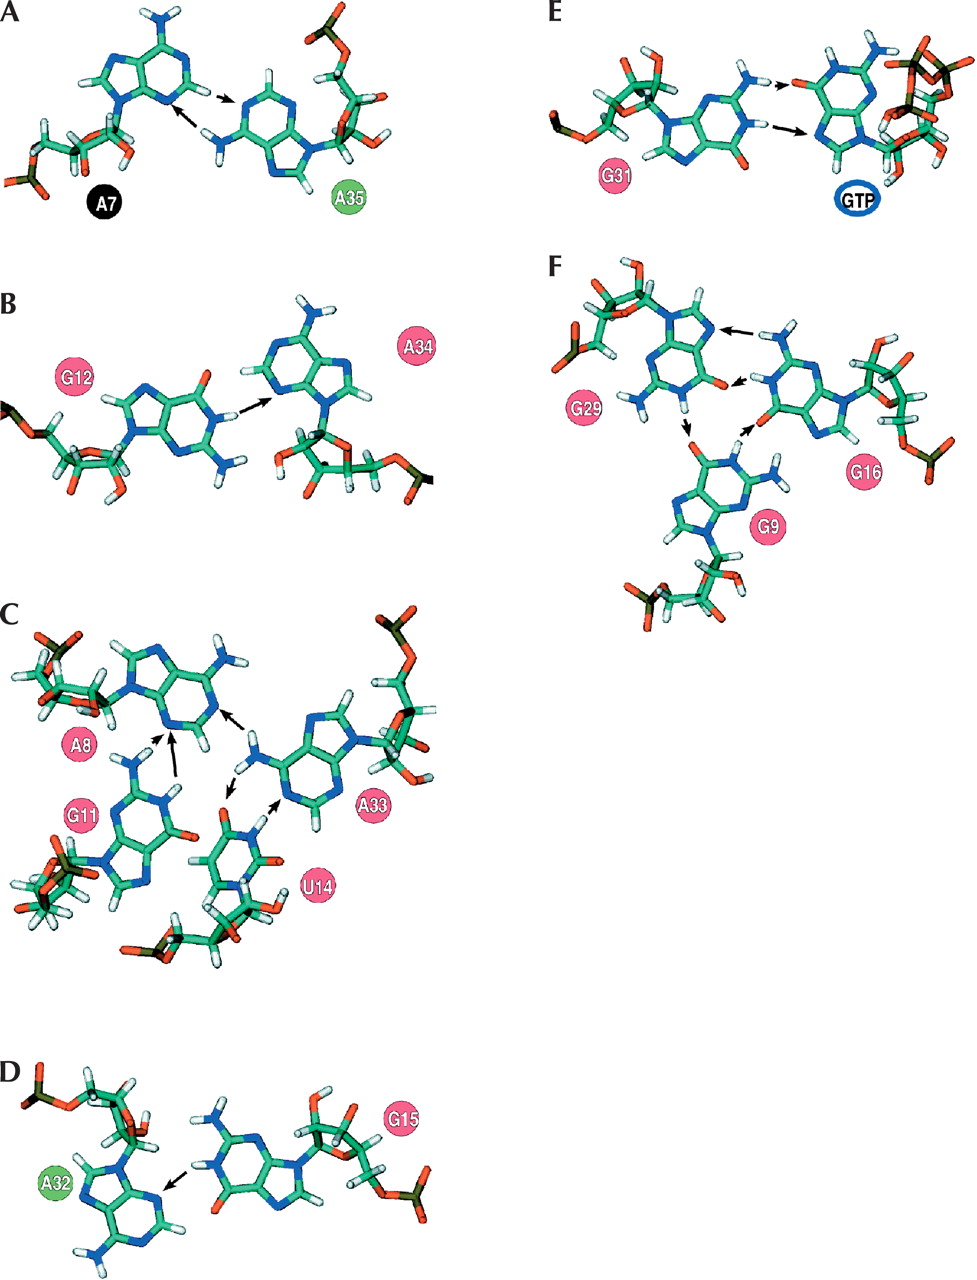
FIGURE 4.
(A–F) Predicted base–base interactions. (A) A:A pairing that caps the P1 stem. (B–F) Base–base interactions that stabilize the core. Putative hydrogen bonds consistent with the structural and spectroscopic data are marked by arrows from donor to acceptor. The identity of each position is colored for sequence conservation in the same manner as in Figure 1. Note that the predicted base–base interactions are present throughout the family of 10 low energy structures shown in Figure 3A.




