


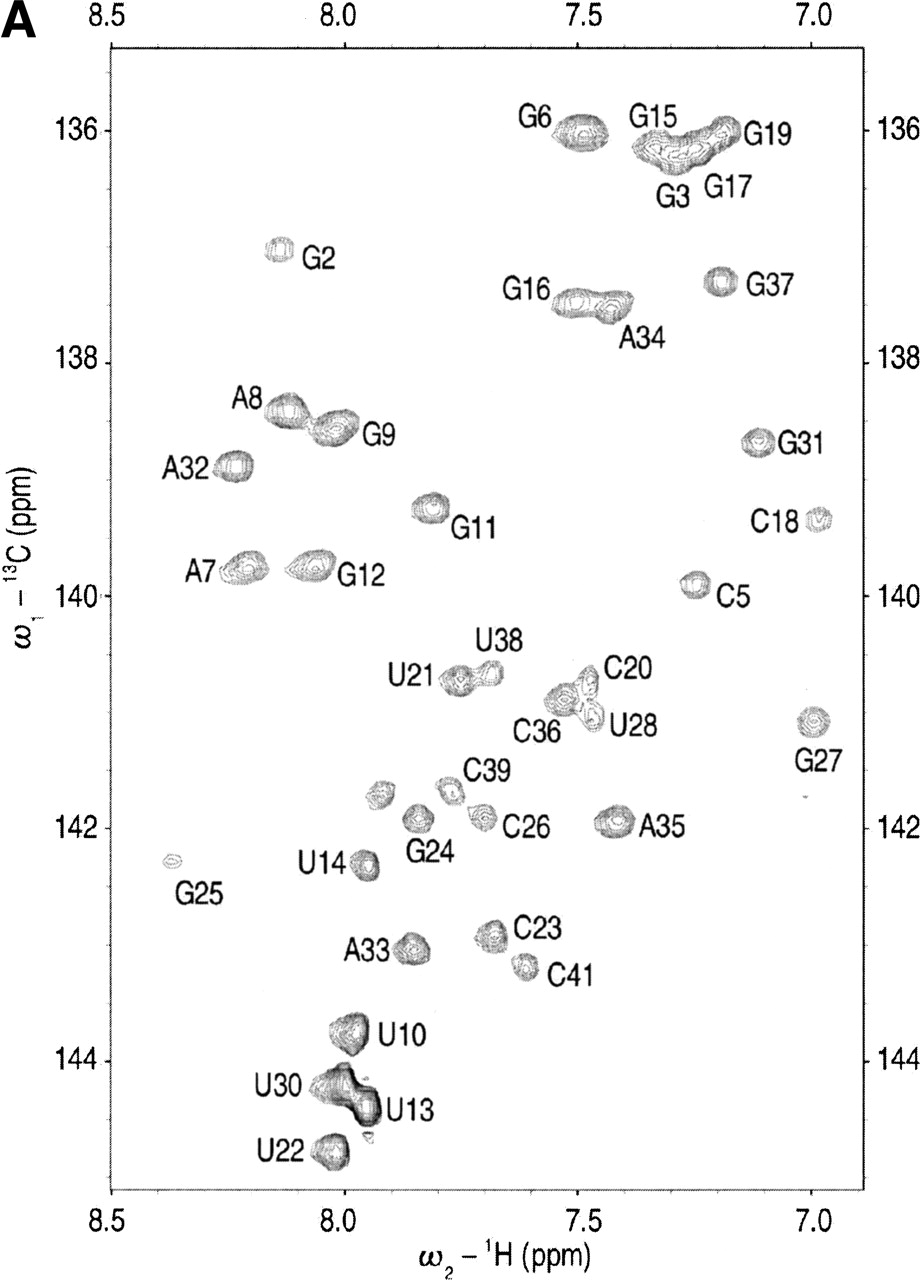
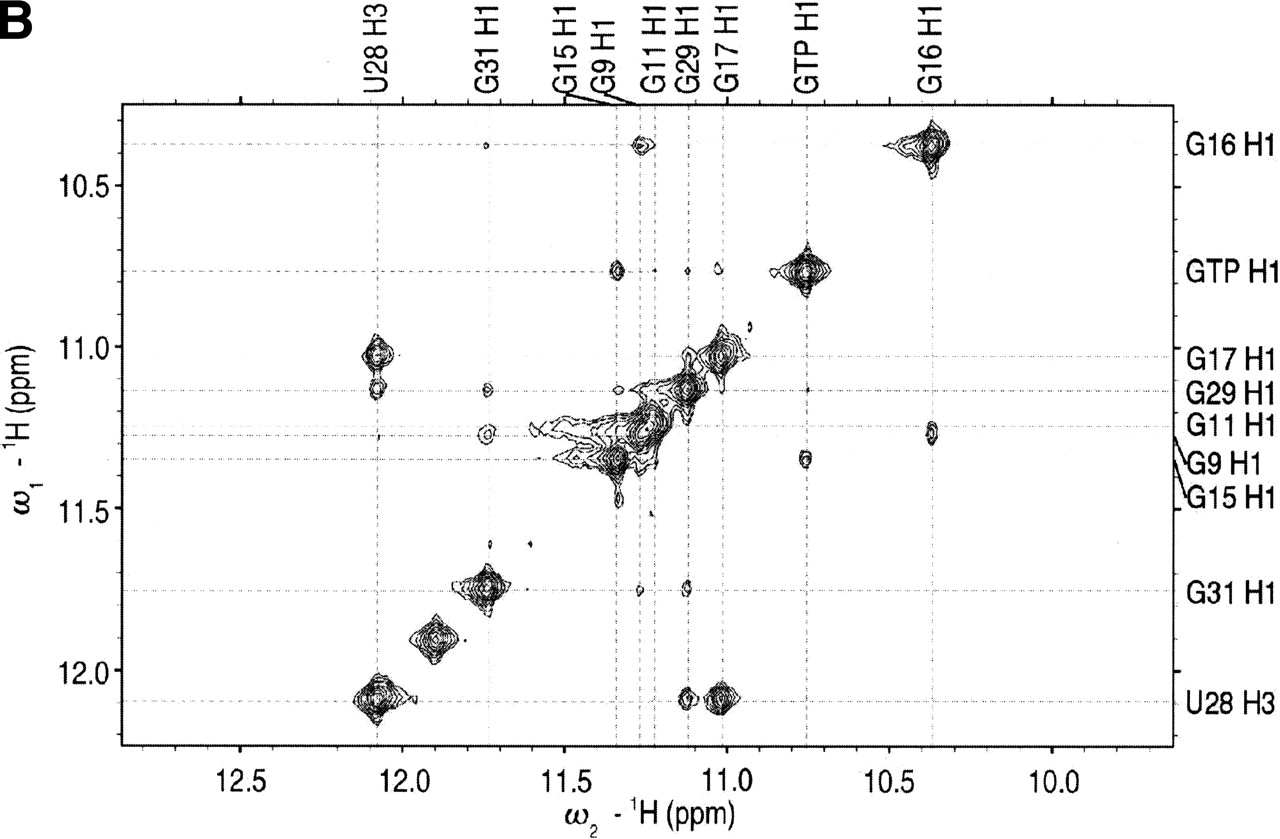
FIGURE 2.
NMR spectra of the Class I GTP aptamer. (A) The aromatic region of a constant time 13C-HSQC experiment at 15°C with uniformly labeled 13C/15N Class I aptamer and unlabeled GTP ligand. (B) Imino–imino region of the recognition bulge in the 100 msec mixing time 2D NOESY in 95% H2O/5% D2O at 15°C. The dashed lines connect NOE cross-peaks among the U (H3) and G (H1) imino protons within the recognition bulge of the Class I aptamer. The resonance at 10.77 ppm marked GTP H1 is the imino proton of the GTP ligand. The H1 imino proton of G6 (11.92 ppm) is not marked in this figure because it is not part of the recognition bulge.




