


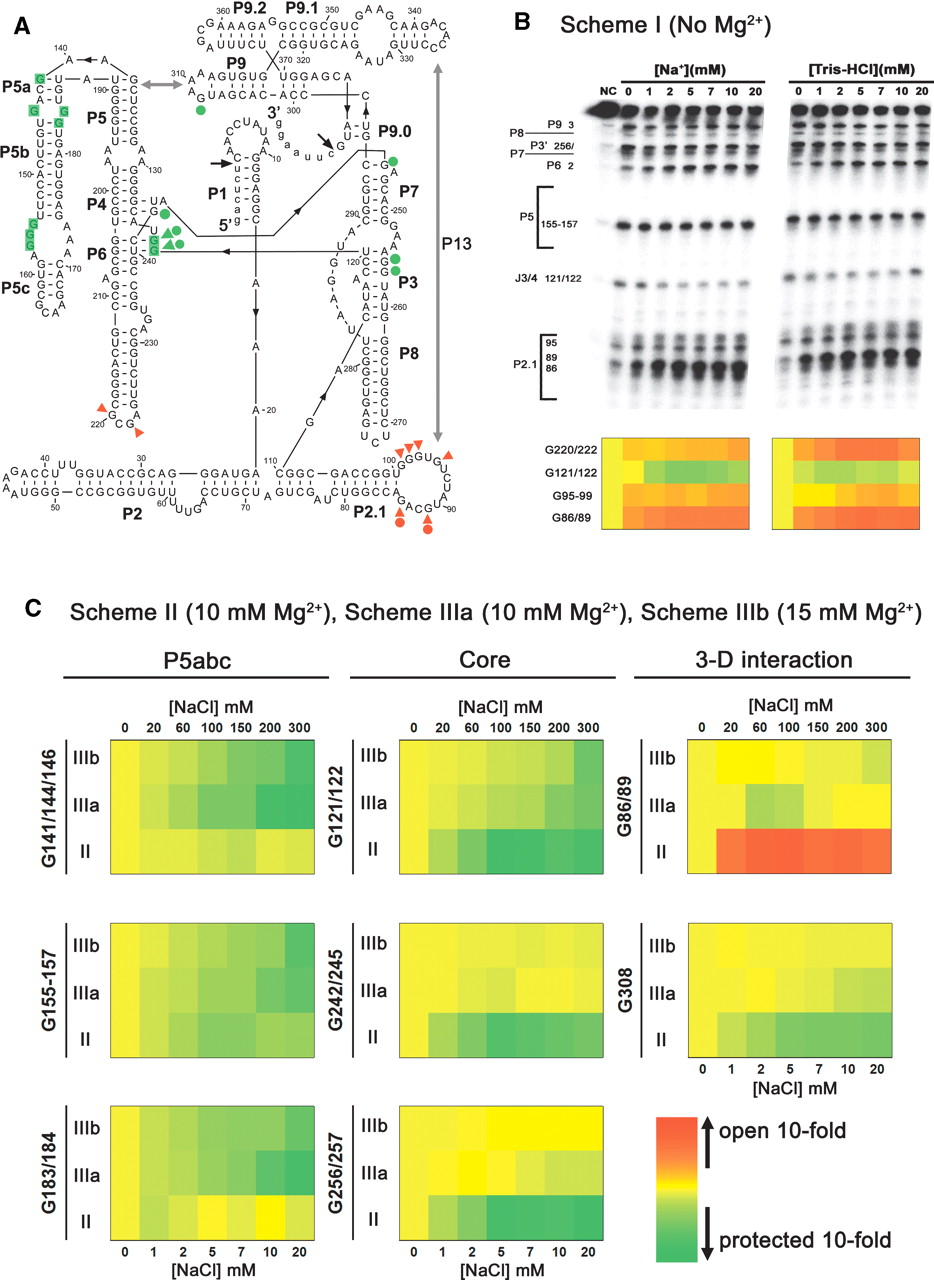
(A) Illustration of the secondary structure of the Candida ribozyme. T1 footprinting results are incorporated into the structure. The Gs whose T1 sensitivity was changed in Scheme I, Scheme II, and Scheme III are indicated as filled triangles, filled circles, and shaded, respectively. The protected and opened Gs are indicated in green and red, respectively. (B) T1 footprinting analysis of the monovalent cation-altered folding starting state. Experiments were done following Scheme I illustrated in Figure 1A, and reactions were fractionated on 8% PAGE/7 M urea gels. Two representative gels (top) for renaturation in NaCl and Tris-HCl (pH 7.5) are shown, with the cation concentrations present in renaturation indicated. False-color maps of G sites showing the altered T1 sensitivity in response to the concentrations of Na+ and Tris+ are shown (bottom). The band intensity at the indicated G sites on the denatured gels was analyzed as previously described (Xiao et al. 2003). For each site, the G-band intensity of the sample lacking monovalent cations (0 mM) was set as the reference, and the G-band intensity for the sample renatured in various concentrations of monovalent cations was normalized to the reference to obtain the ratio. A base 10 logarithm (log10) of each ratio was then calculated and plotted with Kyplot 2.0 software to illustrate the change of T1 cleavage pattern; the decrease (protected) and increase (opened) of the T1 cleavage are plotted in green and red, respectively. (C) False-color maps showing the results of T1 footprinting of the ribozyme structure folded in the presence of magnesium. Only the Gs displaying an altered T1 sensitivity in response to Na+ are shown. Experiments were done following Schemes II and III as illustrated in Figure 1A, and reactions were fractionated on 8% PAGE/7 M urea gels. The band intensity was analyzed and plotted as shown in B. In each map, row II indicates the results from Scheme II, and rows IIIa and IIIb indicate data from Scheme III in the presence of 10 mM and 15 mM magnesium, respectively. The Na+ concentrations labeled at the bottom and on the top of each map indicate those present in Scheme II and Scheme III, respectively.




