


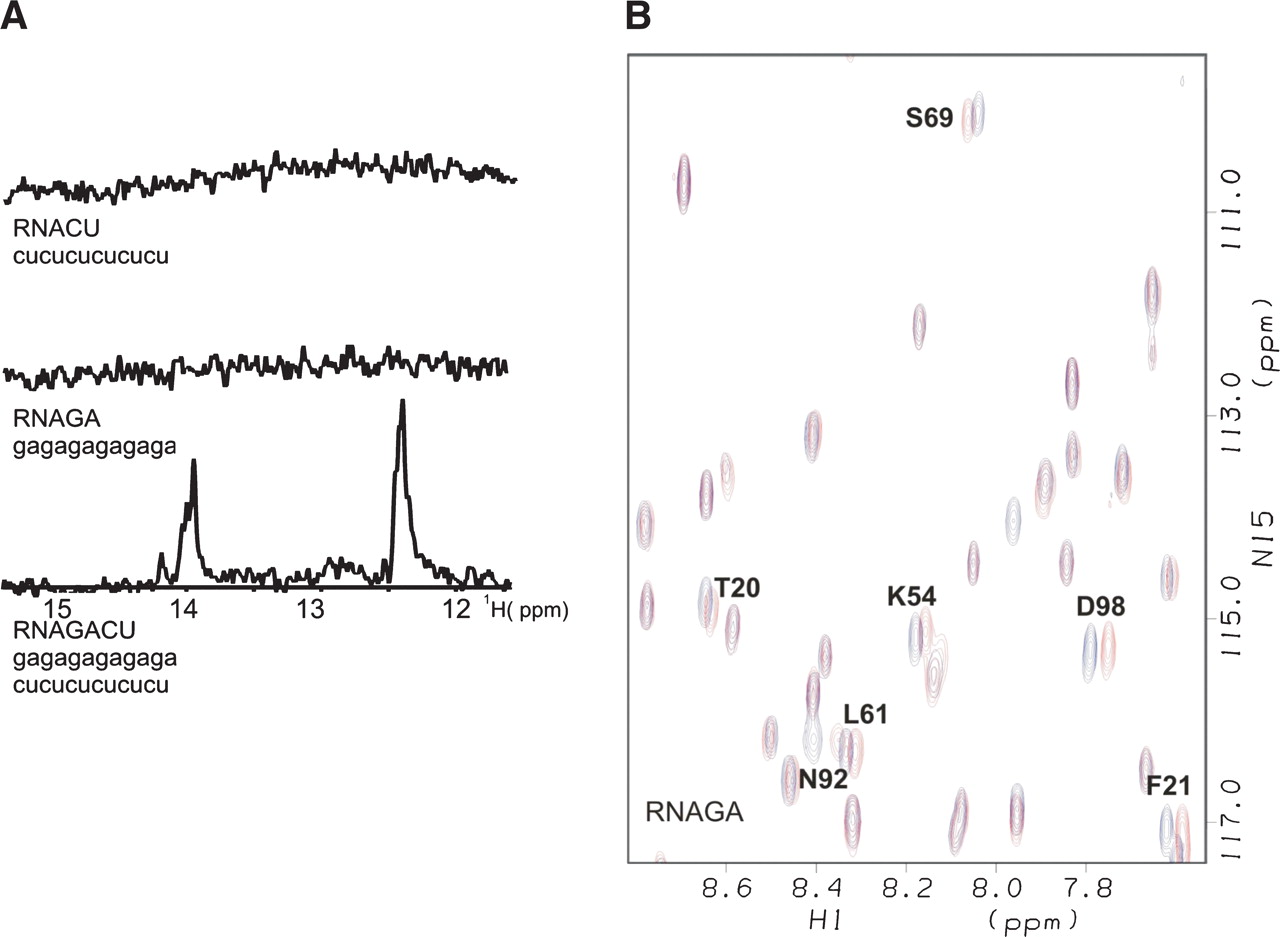
FIGURE 1.
(A) RNA oligonucleotides used in this study and their 1D 1H NMR spectra (imino region). (B) Superimposition of a representative region of the HSQC spectra of Pcf11-CID free (blue) and bound to the GA-rich oligonucleotide (red).




