


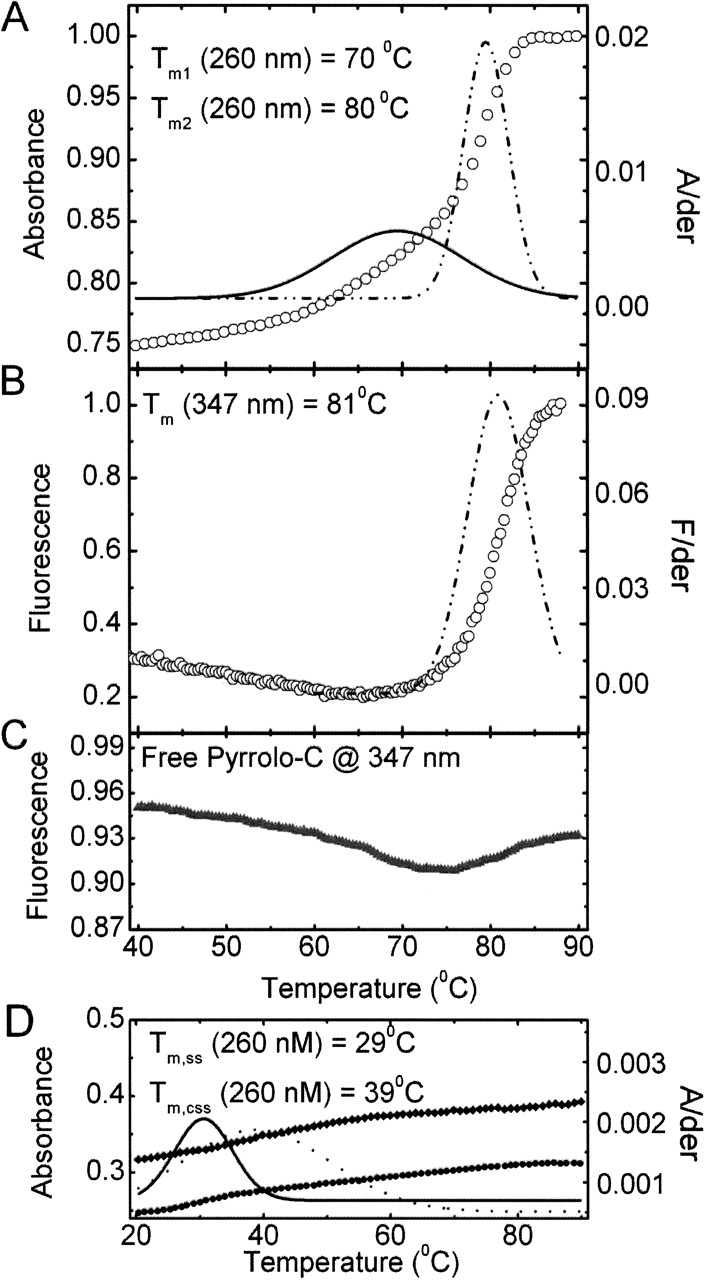
Temperature-dependent UV absorbance at 260 nm and fluorescence emission at 347 nm of dsRNA. (A) UV melting profile of dsRNA. The relative absorbance of the RNA at 260 nm (open circles, left axis) and a bimodal Gaussian distribution fit to the smoothed first derivative (solid and dashed/dotted lines, right axis) are shown. Two different melting temperatures Tm1 and Tm2 are derived (see Materials and Methods). (B) Fluorescence melting profile of ssRNA (open circles), analyzed as described in A. (C) Temperature dependence of the free PC fluorescence (gray triangles). (D) UV melting profile of ssRNA (closed circles) and cssRNA (closed diamonds). The relative absorbance of the RNA at 260 nm (left axis) and Gaussian distribution fits to the smoothed first derivatives (ssRNA, solid line; cssRNA, dotted line) (right axis) are shown.




